Getting TO80
Meeting Ontario's emission targets
The Economic Impact of Electric Vehicle Adoption in Ontario
Full Report
September 2014
Download Full Report or Report Summary in PDF format
Study Authors
- Brent Kopperson
- Executive Director, Windfall Centre
- Dr. Atif Kubursi
- Lead Economist, Econometric Research Ltd
- Andrew J Livingstone
- Freelance Journalist
- Ali Nadeem
- Lead Researcher, Windfall Centre
- Jen Slykhuis
- Program Manager and Research Assistant, Windfall Centre
©2014 Windfall Ecology Centre. All rights reserved. Permission is granted to reproduce all or part of this publication for non-commercial purposes, as long as you cite the source.
PDF copies of this publication may be downloaded from the Windfall Ecology Centre website: www.windfallcentre.ca/drive-electric/studies/ev-adoption/report/
This project was funded in part by the Ministry of Training Colleges and Universities and the World Wildlife Fund. The views expressed in this report are the views of Windfall Ecology Centre and do not necessarily reflect those of the Ministry or WWF.
About Windfall Centre
Created in 1998 by Brent R. Kopperson, Windfall Ecology Centre is a non-profit social enterprise dedicated to building sustainable communities. The creation of Windfall was inspired by a vision of healthy communities, where economic, social, and environmental needs achieve balance through social innovation, community partnership, and community action. The Centre's activities focus on re-powering communities to create lasting wealth in a carbon constrained 21st century.
Working at the nexus of energy, water, food, and people, we research, design, and deliver innovative climate change solutions. Our record of accomplishment includes achievements in public policy, residential energy conservation, renewable energy, electric mobility, water protection and leadership development.
We build opportunities for youth to develop leadership skills into all our activities because helping young people find their place in the world is an important element in building sustainable communities.
Donate to Windfall Centre
We take pride in the high quality of the programs and services offered to our community. It takes a dedicated group of staff, volunteers, and generous supporters from all walks of life to support our work in building a welcoming future for our children. Please become a donor today: www.windfallcentre.ca/donate
Executive Summary
Nations and local governments have already begun to recognize the importance of shifting humanity's approach to the environment. As part of this worldwide movement, Ontario has become a global leader in taking initiative to improve the lives of residents now and in the near and distant future.
However, it needs to do more to affect change on a larger scale. If Ontario wants to meet its target of reducing Greenhouse Gas (GHG) Emissions 15% by 2020 and 80% by 2050, the province is going to have to introduce innovative policies, integrate strategic measures to reduce emissions and work with stakeholders to develop a comprehensive strategy. Otherwise, it's likely to be met with failure.
While Ontario has reached its 6% goal for 2014, the most recent Greenhouse Gas Progress Report says the province will fall 28 Mt short in 2020, making it almost impossible to reach the 80% reduction target in 2050. For success, change is imperative.
This report is the first in a series that examines the economic and labour market impact of achieving Ontario's emission reduction targets. We begin with personal transportation because total emissions in the sector are growing at an alarming rate while solutions are tantalizingly within reach.
The demand for Electric Vehicles (EVs) as a passenger vehicle and also as a fleet vehicle has been on the rise, and the EV industry has made significant leaps in the last few years and will likely command a major share of the industry. Ontario is ideally positioned to be a leader in Electric Vehicle (EV) manufacturing, research and development. Exploiting its strengths in order to carve a niche in the EV industry would boost Ontario's productivity, with potential economic benefits not just for the direct participants in the EV industry but for all of Ontario.
The development of Plug-in Electric Vehicles sustains many economic, environmental and technological gains in the production of electric vehicles, their operation and construction of the supporting infrastructure. Electric vehicles are shown to realize large energy savings and realize many industrial gains but may also cause some disruptions and substitutions in the economy. The net effects, however, are almost all positive. In particular the study demonstrates the following:
- Large energy savings, particularly in those expensive and non-renewable fossil fuels imported from outside Ontario.
- Reductions in CO2 emissions and the prospect of placing Ontario as a frontrunner in the fight to eliminate CO2 emissions.
- Developing a new and dynamically growing industry with a capacity to generate sizeable employment opportunities at the upper end of the wage scale.
- Developing a new infrastructure of charging stations.
- Limited additional electricity generation capacity and delivery systems are needed when the projected shares of EVs are less than 10% of the Ontario fleet of vehicles.
- The phasing out of an old industry and the development of a new industry requires more but manageable numbers of graduates from Universities.
- The estimation of net benefits with a special focus on disruptions, substitutions and changes in the product and factor markets in Ontario all show positive returns and feasible proportions.
The major gains are expected to be in the manufacturing sector but substantial gains can be realized in the energy and infrastructure development sectors. Ontario manufacturing has sustained major losses recently as the Canadian dollar appreciated and provincial productivity declined. Imports of expensive energy, particularly of gasoline, exacted a heavy cost on the economy in step with escalating oil prices. The development and use of electric vehicles holds the promise to save Ontarians considerable amounts of money as cheaper electricity is substituted for the expensive imported gasoline and as a new manufacturing node is developed to shore up the sagging auto sector.
Table of Contents
About Windfall Centre
Donate to Windfall Centre
Executive Summary
A. Introduction
- Emission Reduction & Labour Markets
- Road Transportation
- Research Methodology
- Literature Review
- Ontario Economic Impact Model
B. Background on Ontario
- State of Ontario's Economy
- Ontario's Manufacturing Sector: Industry Profile, Trends and Analysis
- Ontario's Automotive Manufacturing Sector: Industry Profile, Trends and Analysis
- State of Ontario's Environment / Emissions
- Ontario's Road Transportation Sector
- Light Duty Gasoline Trucks and Light Duty Gasoline Vehicles: Trends and Analysis
- Ontario's Emission Targets Going Forward
- CAFE Standards
- Manufacturing and Operational Emissions: Electric vs. Gasoline Vehicles
- Ontario's Emission Intensity.
- Current State of Power Generation in Ontario
- Base load Generation: Nuclear and Hydro
- Peaking and Intermediate Generation: Hydroelectric and Natural Gas
- Variable Energy Generation: Wind and Solar
- Other Arrangements
- Transmission, Local Distribution Companies (LDC) and Planning Regions
- Ontario's Long Term Energy Plan
- Role of Conservation
- Nuclear Energy
- Renewable Energy
- Investments in Transmission
- Ontario's Planning Regions
- EVs and Ontario's Long Term Energy Plan
- Current EV Profile in Ontario
C. Potential Economic Impacts of EV Adoption in Ontario
- Introduction
- Methodology and Approach
- Gross and Net Impacts
- Shares of Electric Vehicles in Total Ontario Passenger Fleet
- Economic Impacts of Manufacturing Gasoline Vehicles
- The Economic Impacts of Manufacturing Electric Vehicles
- The Net Economic Impacts of Manufacturing Electric Vehicles
- Differential Operational Economic Impacts
- Economic Losses on Lower Gasoline Use
- The Economic Impacts of Increased Electricity Use
- The Economic Impacts of Net Savings on Fuel Use
- The Consolidated Economic Impacts of Operational Expenditures of EVs
- Differential Infrastructural Economic Impacts
- Determinants of Demand of EV Sales
- Economic Impacts of Surplus Baseload Generation
- Summary
D. Educational and Employment Requirements
- Introduction
- Projected Employment Growth Rates
- Categories of New Jobs in Demand
- Jobs Created by EV Manufacturing
- Jobs Created by EV Operations
- Jobs Created by EV Infrastructure Development
- Scientific Research
- Design and Development
- Manufacturing
- Maintenance
- Infrastructure Development
- Educational Requirements
- Training and Skill Gaps
- Labour Shortages
- Training
E. Getting To 80
- EV Adoption Scenarios
- Emission Reductions from EV Adoption
- Base Case: 5% Adoption
- EV Adoption as US Telephone
- EV Adoption as U.S Mobile Phone Adoption
F. Conclusion
G. Recommendations
- Recommendations for the Educational System
- Recommendations for the Provincial Government
- Recommendations for the EV Industry/ Employers
H. Appendices
Appendix A: Glossary of Terms
Appendix B: Partner and Contribution Acknowledgements
Appendix C: Assumptions
Appendix D: References
Appendix E: List of Tables and Figures
A. Introduction
Emission Reduction & Labour Markets
The Ontario provincial government through its' Go Green Action Plan On Climate Change sets targets to reduce Ontario's greenhouse gas emissions by 6% by 2014, 15% by 2020 and 80% by the year 2050, all below 1990 levels.[1] Part of this commitment involves transitioning the current mode of mobility towards the electrification of transportation, as personal transportation is one of the largest sources of GHG's contributing to climate change. Based on its commitment, the Ontario Government's ambiguous goal is to have 5% of new vehicles on the roads be electric by the year 2020, but has yet to establish specific sectoral emission targets, including the transportation sector.[2] Considering Ontario is home to 10 automotive assembly plants and 300+ independent parts manufacturers that employ over 90,000 people, transition from manufacturing traditional vehicles to electric vehicles is expected to create more opportunities across various occupations. This shift will create disruptive change throughout business supply chains, the oil and gas industry, energy production and storage and the electrical infrastructure sector. It is anticipated that employers and businesses will feel the effects of the transition to EVs as new jobs get created while existing jobs become reallocated, phased out or adapted with new skills. The advancement of public transit will also be a defining factor in reducing emissionsfrom the transportation sector, however this is not included as part of our analysis in this report.
The Ontario government supports the development of green jobs and a green economy, however, there is little published work to assess the full impact EV adoption will have on the current and future labour market in Ontario at this time. The industries we predict will be affected by this transition will require a highly-skilled and very knowledgeable workforce. However, the skilled trade workforce is aging and fewer young people are entering into apprenticeships and higher STEM education (Science, Technology, Engineering and Math). As electric mobility continues to grow, it is evident new skill gaps will emerge and a diversification of existing skills within the current labour market will be required to carry out the electrification of transportation initiatives.[3] As outlined in the Greening the Economy, Transitioning to New Careers, a study by the Workforce Planning Board of York Region et al., economic competitiveness and successful transition to a green economy at the regional and business levels is dependent on both a strong economic position and a skilled workforce. Consequently, employers will need to seek individuals who have the skills and knowledge required as Ontario moves towards the adoption of electric mobility.
Road Transportation
According to United Nations Intergovernmental Panel on Climate Change (IPCC), the road transportation sector consists of the following categories: light duty gasoline vehicles, light duty gasoline trucks, heavy duty gasoline vehicles, motorcycles, light duty diesel vehicles, light duty diesel trucks, heavy duty diesel vehicles, and propane & natural gas vehicles.
The personal transportation sector is a subset of the road transportation sector and consists of light duty gasoline vehicles (LDGVs) and light duty gasoline trucks (LDGTs). For the purpose of this report, and the scope of our research, we have focused only on Light Duty Gasoline Vehicles (LDGV) in the personal road transportation sector in Ontario.
For the scope of this report, we have focused on Electric Vehicles technology, which is defined as a Battery Electric Vehicles (BEV). We have excluded Plug-in Hybrid Electric Vehicles (PHEV) in our analysis.
Battery Electric Vehicles (BEV): Battery Electric Vehicles operate entirely on an electric motor powered by a battery. This battery is charged through an electrical outlet.
Plug-in Hybrid Electric Vehicle (PHEV): Plug-in hybrid electric vehicles have additional battery capacity and can be charged through an electric outlet when parked. Plug-in hybrids are able to travel in all-electric mode at higher speeds and for extended distances without using the combustion engine.
Electric Vehicles (EVs): As used throughout the report EV refers the BEV definition.
Research Methodology
Windfall Centre researchers conducted both primary and secondary research for this report. An advisory panel was formed with participants from various sectors relevant to the project and were chosen based on their expertise and experience. The advisory panel members, along with other individuals, participated in email and telephone surveys in order to gain an in-depth understanding of the various sectors relevant to the labour market and economic impact study of EV adoption in Ontario. Secondary research was also conducted by collecting, organizing and analyzing data sets and reports from various public sources, such as Statistics Canada, Electric Mobility Canada (EMC) and Ontario Power Authority (OPA). Windfall Centre also purchased additional industry reports from Electricity and Human Resources Canada and Navigant Consulting to supplement any research and information gaps. Windfall Ecology Centre engaged Econometric Research Limited (ERL) to conduct an economic impact analysis and create a model to identify and quantify the economic and labour market impacts of EV adoption in Ontario. Internal research pertaining to the state of Ontario's economy, labour markets, various emissions and economic indicators was conducted by Windfall Centre researchers.
Literature Review
There is limited research on the economic and labour market impacts of EV and electric mobility adoption. It is important to understand the potential implications of adopting a new technology and transforming our personal modes of transportation. This section discusses the seven main economic impact studies that were used to create an analysis of the effects of electric vehicle adoption and the electric vehicle industry in European Union (EU) countries, Austria, and in the United States (U.S.), particularly in Oregon and California and the greater Cleveland, Ohio area. The section discusses the methodology, the assumptions, various scenarios and the economic impacts on the aforementioned regions.
Douglas S. Meade published one of the first economic impact studies of relevance to the EV industry in 1995. The impact of electric car on the U.S economy: 1998 to 2005 uses the INFORUM LIFT macroeconomic inter-industry model of the U.S. to analyze the industry and the impacts of the structural change in the motor vehicle industry. The EV penetration rate, which is the share of EVs out of total vehicles, is set at 3.6 % by 2005 in all of the US. The results of the study show that macroeconomic effects are minimal but impacts on particular industries are significant given the small level of market penetration.
The INFORUM LIFT model is an inter-industry model that forecasts results for 85 industries in the U.S. The model tracks not only macroeconomic effects but also industry output and employment, and interdependence among industries. This study highlights the compositional differences between EVs and internal combustions engines vehicles (LDGV vehicles). Most input requirements of EVs are similar to those of LDGVs, however, there are certain components absent from composition. Electric Vehicles are made of an aluminum chassis, plastic and composite body parts, less ferrous metals, and more plastics and non-ferrous metals and copper, increased use of miscellaneous electrical equipment, communications equipment and electronic components, and electrical industrial equipment1.
The results of the model show most employment and output gains are expected in the following industries: miscellaneous electrical equipment, communication equipment and electronic components, and especially electrical industrial equipment associated with battery production activities. All these gains are a result of an increase in demand of electric car inputs which are directly correlated with an increased demand in EV usage. The most significant impacts on a macroeconomic level were experienced in petroleum and electricity consumption. According to the model, drivers would spend an additional $326.2 million on electricity in 2003, $526 million in 2005, and save $877 million in petroleum consumption in 2003 and $1.295 Billion in 2005. However, expenditures on auto repair jumped to 371 million by 2003 due to increased costs of replacing batteries in the electric car compared to the standard maintenance of a typical gasoline car. Finally, investment in charging stations by electric utilities is up about $500 million by 2003. Under the model, no disruptive changes are expected as a result of the substitution of gasoline-powered vehicles for electric vehicles. Changes in various industry sectors are more noticeable than changes in overall U.S. economy. The output of crude petroleum and petroleum refining industries' decreased every year from 1998 to 2005, whereas the electric utilities industry's output increased. By 2000, changes in both direct demand and total demand in petroleum refining decreased, and change is attributed to indirect demand for petroleum refining, most likely by the demand arising from increased production in the electric utility activities. The change in indirect demand by the electric utility industry for petroleum refining is even higher in 2005 and for the utilities industry most change in demand is the result of change in direct demand. The motor vehicle industry experienced a reduction in output because electric cars require less inputs and the production of traditional motor vehicle inputs transitioned into production of EV inputs such as batteries and other electrical components.
In terms of employment, significant differences are experienced in more labour intensive industries. The largest employment gains were in electric lighting and wiring, automobile repairs, communication equipment, electric utilities, and electrical industrial apparatus and distribution equipment. The biggest employment loss was in motor vehicles, wholesale trade, crude petroleum, natural gas, and ferrous metals. Overall, there is a net gain of 21,000 jobs by 2003. The majority of job gains are a result of the additional resources required to produce and maintain electric cars and the analysis in this study suggests a higher initial purchase price in addition to significant costs of battery replacement as each car ages. Therefore, the increase in employment is similar to that caused by a reduction in productivity. Directly and indirectly, it requires more labor services to produce an electric car than a conventional gasoline car.
Although many assumptions made in this study could be criticized, it provides a qualitative insight into what industries could be affected, the direction of this effect and some indication of the magnitude of changes. In reality, the actual penetration rates could differ, electricity consumption of an EV fleet could be higher or lower and production activities, though similar, could differ from one region to another, and many other scenarios not incorporated in the study could affect the EV industry. However, the study gives a good indication that results are more important for individual industries and these impacts could be much larger if the penetration rates were higher.
The University of Maryland and Keybridge Research LLC conducted a much more detailed analysis of the impacts on the U.S. economy as a result of policies designed to encourage the uptake of EVs. Released in 2010, Economic Impact of Electrification Roadmap looks at transitioning fuel based light duty vehicle fleets to electricity and what the impacts would be on the national economy. The study analyzes the economic impacts of policy directives articulated in Electricity Coalition's (EC) 2009 report Electrification Roadmap. The analytical exercise conducted for this project utilized a highly respected Inforum LIFT model, a general equilibrium econometric model of the US economy. The model determines changes in various economic indicators between base case and specific policy objective case by 2040. The analysis is conducted for the period between 2010 and 2030. The base case scenario incorporates an annual GDP growth rate of 2.5%, annual crude oil price growth of 3.2% with the crude oil price reaching $233 by 2030, approximately $149 per barrel in constant 2008 dollars. The policy objective for 2040 is to transform 75% of the passenger vehicle miles travelled in the US into electric miles. According to projections by the Department of Energy and the US automotive industry, the total number of miles travelled by light passenger vehicles would reach 4.2 trillion in 2040 and total electric miles travelled would need to reach 3.2 trillion in that year in order to accomplish the 75% electrification objective. The displacement of petroleum fueled vehicle miles travelled should result in reduced consumption of petroleum by light duty passenger vehicles that would result in a savings of 6 million barrels of oil per day.
In the base case scenario in 2010, EVs which include both PHEVs and BEVs have 0% share in sales and total stock but in the policy case, EV sale shares are 91.2% and EV stock share is 42.4% by 2030. Results based on the modeling exercise show that with the aforementioned sale and stock shares of EVs, total employment would increase by 1.9 million jobs. By 2030, there would be 560,000 more manufacturing jobs, 276,000 more jobs in travel and tourism, and 73,000 more jobs in professional services. Additionally, Employment in the motor vehicle industry (including motor vehicle parts) would be about 106,000 jobs higher than the base. Employment in the industries that supply key electric and electronic components to electric vehicles would increase by 112,000 jobs. The federal budget would also improve by a cumulative $336 million from 2010 to 2030, net of policy costs. Additionally, by 2030, US trade balance would also improve by about $127 billion dollars (2008 dollars).The budget improves as a result of higher levels of income and GDP from the policies mentioned in the Roadmap. The annual household income would by 2.2% per household, an increase of $1,763 (2008 dollars). Cumulatively households would experience an increase of $4.6 trillion (2008 dollars) in aggregate income from 2010 to 2030.
The analysis in this report also projects household savings. By 2030, a typical household in the U.S. would spend less per year directly on energy for transportation. This savings, coupled with higher income, means the typical household would be able to enjoy approximately $3,687 (2008 dollar) more in consumption of goods and services or personal savings by 2030.
U.S. crude oil and petroleum product imports would fall sharply by 3.2 million barrels per day by 2030. Cumulatively, the U.S. would import nearly 11.9 billion fewer barrels of foreign oil from 2010 to 2030. This compares to estimated reserves of 4.3 billion barrels for Prudhoe Bay, and slightly less than 30 billion barrels for total U.S. proved reserves. The very high adoption scenario significantly impacts world demand for oil. As the U.S. embraces electrification, world demand for oil would fall leading to lower world oil prices. The report also mentions that the price of oil would be almost 7% lower by 2030 than it would be without the Electricity Coalition's (EC) policy package, and that the U.S. economy will be stronger and more resilient. Once fully implemented, the EC policies would mitigate roughly one-third of the economic losses caused by a future oil price shock. By 2025, the EC policies would prevent the loss of 1.4 million jobs in the first year alone of a price shock-induced recession.
David Roland-Holst extends the economic impact analysis to the state of California. In the 2012 report Plug-in Electric Vehicle Deployment in California: An Economic Assessment, Roland-Host discusses the economic and environmental impacts of electric vehicle adoption through analysis for the State of California. A state of the art economic forecasting model was used to determine the linkages between various scenarios of plug in electric vehicle (PEV) deployment, economic growth, and job creation. The results of this study are similar to those articulated in the aforementioned economic impact studies and it reaffirms the positive economic impacts of electric vehicle adoption. The study finds that Light-duty vehicle electrification can be a potent catalyst for economic growth, contributing up to 100,000 additional jobs by 2030. On average a dollar saved at the gas pump and spent on other goods and services that households demand creates 16 times more jobs.
The study analyzed three scenarios: base line scenario, 15.4% PEV deployment in the new light duty vehicle fleet by 2030, and 45% PEV deployment for new light duty vehicle fleet by 2030. The long term aggregate economic effects of the two vehicle deployment scenarios indicate that new vehicle technologies, particularly those that reduce reliance on fossil fuels, stimulate economic growth and create jobs. The projections in the model also show that total employment grows in all sectors but it grows relatively slowly in fossil fuel-related sectors, and that the magnitude of economic impacts depends on the degree and scope of EV adoption. The resulting economic changes from PEV adoption are a consequence of a mechanism called expenditure shifting. Savings experienced by both households and enterprises as a result of reduced petroleum and diesel demand are spent on consumer goods and services. Consumption on goods and services tends to create more jobs per dollar of demand than the fossil fuel supply chain, and thereby creates substantial employment growth. Newly created jobs enhance the multiplier effect by leading to even more spending, consumption, additional employment, and thus enhancing the economic growth even further. Moreover, jobs created from the expenditure shifting are distributed across a broad spectrum of sectors and occupational categories, and not just restricted to green technology and import-driven energy fuels and services. Most of these jobs created by PEV adoption is in the service industry with high levels of instate inputs and value added. Such instate jobs have stronger and longer multiple linkages and are for the most part long term in nature, and less likely to be outsourced. Regardless of individual consumer decisions on whether to purchase a new car or not, Californians will always gain from economic growth associated with fuel cost savings. As a result of light-duty vehicle electrification, the average real wages and employment increase across the economy and incomes grow faster for low-income groups than for high-income groups.
Electric Power Research Institute (EPRI) extends its analysis to a much smaller region in its 2009 report Regional Economic Impacts of Electric Drive Vehicles and Technologies: Case Study of the Greater Cleveland Area. Looking at the regional economic impacts associated with large scale use of PHEVs and EDTs (electric drive technologies) in Cleveland, Ohio. EDTs include truck stop electrification, off-road industrial vehicles, alternative marine power, electric transport refrigeration units, on-road battery electric vehicles, and lawn & garden equipment. This study examines the regional effects as a result of petroleum displacement, increased electricity demand and annual fuel cost savings by consumers. The study applies regional input-output (RIO) analysis and quantifies macroeconomic impacts of transportation fuel switching, from gasoline to electricity, by assuming five different price scenarios and using two modeling approaches. RIO analysis tracks the economic impact from shifts in economic activity within a regional economy. It not only captures directs impacts such as those resulting from shift in household spending from gasoline to electricity but also indirect and induced impacts. Moreover, RIO methodology measures the shift in demand for all production inputs due to changes in demand for a final product: in the case of electricity production, inputs would be fuel purchases, equipment purchases, labour, and maintenance services.
In addition to quantifying effects of spending shifts, the study also analyzes the economic impacts of regional industry development related to electric market penetration in Cleveland. Both EDTs and PHEVs provide economic benefits by displacing expensive petroleum with cheaper electricity and therefore provide fuel cost savings to consumers. Petroleum expenditures tend to leave the region especially if it is imported. The cost savings from lower petroleum consumption tend to have a trickledown effect as these savings get absorbed and consumed by the regional and local economy. This economic effect is further enhanced by increased demand of electricity, which is cheaper to use than petroleum. The study further shows that higher PHEV and EDT usage not only lowers annual fuel bills, leaving consumers with more disposable income to spend on goods and services, but also nurtures growth and development of industries associated with electric drive technologies, including new vehicle production, battery manufacturing and recycling, infrastructure development, and research and development. Such levels of increased industrial activity and output require increased levels of labour, employment and income in the region. New earnings by both individuals and businesses culminate in additional spending on local goods and services, creating an economic multiplier effect throughout the region.
This study is particularly relevant because many regions in Ontario face a similar economic situation as Cleveland. In Ontario, many regions that once had a robust auto manufacturing sector are now faced with lower levels of output and employment, a situation very similar to Cleveland. The Ohio city has traditionally had a robust auto manufacturing sector but now faces various competitive challenges especially from overseas labour markets. The large scale development of PHEVs and EDTs and supporting industries is a potential path to compensate or recuperate for past losses to foster future gains in the manufacturing sector.
The research conducted in this study demonstrates that with petroleum prices at or above 2006 levels, significant economic benefits can be gained through the use of electric transportation technologies in the Cleveland region. Additionally, the study shows that focused and targeted development of support industries that facilitate the transition to electric transportation could generate tremendous economic benefits for the region. EPRI (2009) states that overall, the effects of a shift from petroleum to electricity in the transportation sector could potentially generate a net gain of tens of thousands of new jobs in the Cleveland area and increase regional economic output by billions of dollars annually.
Northwest Economic Research Center (NERC) takes a different approach in its analysis. Most of the studies discussed in this section analyze economic impacts of EV adoption, but NERC analyzes the economic impact of the entire EV cluster in its study. EVs in this study are defined as hybrid, plug in hybrid, all electric vehicles and a vehicle that uses a continuous supply of electricity, such as a street car. In its 2013 report Oregon's Electric Vehicle Industry NERC defines EV industry, identifies the EV cluster and determines and analyzes the economic impacts of the EV cluster in Oregon. There are no NAICS 2 designations or codes to track economic activity in the EV industry and most available data is mixed in with data from other industries making the isolation of EV relevant data particularly challenging. In order to isolate pertinent EV data and to better analyze relevant economic effects of the EV cluster in Oregon, NERC created a supply chain of raw material and parts/components suppliers, engineering and design firms, charging infrastructure manufacturers and installers, downstream activities that occur after the production of EVs, and ancillary organizations that support the core EV industry. Data was then collected through a survey filled out by various companies in the EV cluster and then this data was analyzed using IMPLAN, which is input-output software. Based on this analysis, NERC estimates that the economic activity from the Oregon EV industry, comprised of about 100 companies, creates 1,169 jobs, in addition to the 411 full-time jobs created directly for a total impact of 1,579 jobs. The industry generates gross economic activity of $266.56 million, total value added of nearly $148 million and provides over $89 million in total employee compensation.
Additionally, the industry generates a significant amount of tax revenue for the state and federal governments. NERC estimates total state and local tax revenue of $11.9 million and federal taxes of $20.8 million. Interestingly, Oregon's EV industry continued to grow during the recent recession while other transportation industries suffered enormous losses. In particular, the manufacturing, parts and components sectors enjoyed large growth during the recession.
In order to extend our review of the economic impact analysis to various global geographical locations, we have included studies on the European Union (EU) and Austria. Price Waterhouse Cooper (PWC) conducted economic impact analysis of Austria and presented its findings in its 2009 report The Impact of Electric Vehicles on Energy Industry. This report analyzes impacts of electric vehicles on Austria's total emissions, electricity generation, power grid, and national economy. The study analyzes data and information on passenger cars, two-wheeled vehicles (motor bikes, small mopeds, and mopeds) and light vehicles. This study takes into account purely battery electric vehicles only and is based on the assumption that 20% of passenger cars, light duty vehicles and two wheeled vehicles would be electric in 2020 and 2030.The level of electricity required for charging vehicle batteries was added to total daily electricity demand, and the assumption was made that vehicles would be charged in the evening or overnight. Vehicles would take 7 hours to charge at home and would be taken to a charging station during the day only when battery is completely empty. This study has determined that 20% coverage (approx. 1 million electric vehicles) would lead to a 3% increase in power consumption and would not require construction of further power plants. However, the power grid would have to be restructured to cope with additional demand when it occurs. The adjustments to the grid and the distribution network would be required where charging points would be located. Introducing electric vehicles to the Austrian market would require the installation of approx. 16,200 electric vehicle charging points. The analysis concludes that if electric vehicles are mainly introduced in cities, approx. 2,800 charging points would need to be installed. These installations plus network connections would require approximately $111 million Euros ($142 million Cdn) and $650 million Euros ($835 million Cdn), respectively.[4]
The study determines that 20% coverage could reduce total carbon emissions produced in Austria by 2 metric tons, which is a 16% reduction in carbon emissions caused by passenger cars, light duty vehicles and two-wheeled vehicles. Furthermore, 20% coverage would lead to an energy reduction of approx. 8.4 Terra Watt Hours (TWh), which would be approximately 37% of Austria's energy efficiency target for 2016. The economic impacts of 20% coverage are assessed in the form of cost-benefit calculations and comprise of impacts pertaining to tax deferrals, changes in oil imports, consumption changes as a result of changing demand requirements in electricity, petroleum and diesel, and investments in networks, charging stations, and electricity generation. Introduction of electric cars would result in reduced sales in petroleum, diesel and eventually reduced levels of crude oil imports. These reduced levels would lead to an increase in capital available to the national economy and more capital for investments especially in battery charging stations. Furthermore, the economy would experience surplus from additional electricity sales and additional power network usage, and a reduction in fuel tax revenues as demand for fuel decreases. The ability to resupply electricity with battery capacities not being used (through parked electric vehicles) would also result in a reduced need to expand power stations, thereby leading to reduced investment. The overall economic impact generally paints a positive picture, with the effect on the national budget being largely neutral (slightly negative in 2020 and slightly positive in 2030). The most positive effect will be felt by energy suppliers, which will hugely benefit through a positive net effect of up to around $1.3 billion Euros ($1.67 billion Cdn).[5]
Ricardo-AEA and Cambridge Econometrics (2013) discusses the economic impacts of adopting low carbon vehicles in the European Union. This study focuses on light duty vehicles: cars and vans. The results of this technical and macroeconomic study suggests a transition to low carbon technologies increases spending on vehicle technology, thus increases direct employment, and decreases expenditure on gasoline products, thereby creating indirect employment.
The first of a multi-phased approach examines the impact of improving vehicle efficiency by improving internal combustion engines through light weighting, engine-downsizing and hybridization. The second phase examines the impact of transitioning from fossil fuel energy resources to clean energy such as hydrogen and electricity. In the first scenario, cars and vans achieve the EU's proposed 2020 CO2 target of 95g/km and 147g/km, respectively, and efficiency improvements continue at about 1% per annum thereafter. In the second scenario, cars and vans achieve a slightly higher efficiency level in 2020 and continue along a similar trajectory of around 3% annual improvement thereafter. In the first scenario gasoline and diesel hybrids electric vehicles (HEV) are deployed at penetration rates of 10% in 2020, 22% in 2025 and 50% in 2030. The results show reduced spending on fuel more than outweighs the increased spending on vehicle technology to reduce carbon emissions.
According to the study, individual consumers spend about $1,000 to $1,100 euros more on a vehicle in 2020 due to additional vehicle technology than the average car manufactured in 2010. However, this additional cost would be offset by annual savings of around $400 Euros on fuel. On an EU level, the total capital costs of additional vehicle technology would be approximately $472 billion Euros in 2030, which is about $46 billion Euros more than the base scenario. However, this additional expenditure would be offset by avoided fuel costs of $79 billion Euros, and the cost of operating and renewing the EU car fleet in 2030 would be about $33 billion Euros less than in the reference case. These efficiency improvements feed through the economy in two ways. First, there is direct benefit to GDP from reduced imports of fossil fuels because it improves the trade balance. Second, there are indirect benefits to households and businesses, as lower operating costs are passed on in the form of lower prices to consumers. These lower costs not only represent additional real incomes for consumers, but also savings for businesses.
The model used in this study shows that increased spending on vehicle technology leads to job creation in the manufacturing of fuel efficient automotive components and from a general boost to the economy as a result of decreased spending on imported oil. Although the overall combined effect on GDP is neutral in all scenarios, 413,000 net jobs are created in the highest case scenario. This is derived from the fact that most money spent on oil leaves the economy while most money spent on fuel-saving vehicle technology remains in Europe as revenue for technology suppliers and companies that supply fuel efficient technological components benefit from increased revenue due to increased demand of such products. The model also incorporates sectors that lose jobs such as refining, distribution and retail of fossil fuels. The positive impact on jobs and GDP was highest in sensitivity analyses with high international oil prices due to increased value of avoided fuel consumption.
These seven studies emphasize the importance of higher levels of EV adoption for regional economic growth. Displacement of petroleum products such as fuel in favour of electricity, investment in parts, components, and technologies that make up an EV and investments in an infrastructure network that supports EV uptake enhances economic growth in many ways. Money saved as a result of lower oil consumption is used for other productive activities such as increased consumption expenditure on goods and services, and capital investments that support the EV industry. Money that would have been spent on oil and other petroleum products is circulated in the domestic economy, creating wealth through the economic multiplier effect, where every dollar spent equals an additional dollar spent by some other member of society, creating an economic ripple effect. Furthermore, EV uptake creates a new industry that in itself is a source of job creation, additional incomes and higher regional GDP. Lastly, higher EV penetration in both new sales and total stock of light duty passenger vehicles is vital to reduce the regional carbon footprint.
Ontario Economic Impact Model
The impact model used in this exercise is a special application of Econometric Research's (ERL) generic Regional Impact Model (RIM). It is a unique model that captures the economic impact of expenditures at the local level (counties or economic regions), the provincial level (Ontario) and the national level. The model is based on a novel technology that integrates input-output analysis and location theory.
The RIM impact system comprises many modules. The most relevant for this project are the labour market and environmental modules. The labour market module generates employment by sector and occupation. The environmental module generates the direct and indirect environmental impacts of a large set of environmental indicators including emissions, waste, energy consumption and green GDP.
The economic impacts of automotive manufacturing are driven by the cost of the vehicle spread over the input shares in the input-output structure of Ontario for automotive gasoline cars and by the adjusted bill of materials of EVs where metal fabricated components are partly replaced by electrical and computer parts.
B. Background on Ontario
State of Ontario's Economy
Ontario is the largest contributor to national GDP, federal tax revenues, is Canada's largest province by population, and also its largest exporter. Since 1997, Ontario's economy has transitioned into more service-based than a goods' producing economy. The service sector now constitutes a larger share of the provincial GDP than the goods producing sector. Even though both goods producing and service producing sectors have grown from 1997 to 2012, the service sector has experienced a higher annual growth rate than the goods producing sector. Figure 1 shows the relative contributions to Ontario GDP and relative growth rates of the two sectors between 1997 and 2012. In addition to Ontario's transition to the services' sector, it has also experienced a significant decline in the total employment and output of its manufacturing sector. This downward trend in manufacturing GDP and manufacturing employment is worrisome because Ontario's manufacturing sector is responsible for 46% of all Canadian manufacturing output and 44% of all Canadian manufacturing jobs.[6]
Even though manufacturing is still a major component of the provincial GDP, its share has been decreasing, while other industries, such as the construction industry, have increased their provincial shares. Ontario's automotive manufacturing sector has experienced similar declining trends in both total output and total employment levels as the overall manufacturing sector during the same period.

Ontario's Manufacturing Sector: Industry Profile, Trends and Analysis
Ontario accounts for 46.1% of Canada's total manufacturing output and 44% of the country's total manufacturing employment.[7] Most of Ontario's manufacturing clusters are based in and around the City of Toronto, Peel, Waterloo, York, Durham, Essex, Halton, the City of Hamilton, Middlesex, Niagara and Simcoe counties or regions.[8] According to the Mowat Centre report Ontario Made: Rethinking Manufacturing in the 21st Century, the majority of Ontario's manufacturing firms are small-sized businesses with fewer than 50 employees. Approximately 13% of companies are in the medium size segment, employing between 50 and 500 people, and large companies that employ more than 500 employees, account for only 0.6 % of Ontario's manufacturing workforce.
Historically, Ontario has had a robust manufacturing sector and it still maintains a sizeable share of the provincial GDP even though its total share has decreased between 2008 and 2012. Ontario's manufacturing sector contributed 22% to the GDP in 2002; however, from 2009 to 2012 its provincial share was only 13%. Ontario produced $98 billion in manufacturing output in 2000 and since then its manufacturing GDP has decreased almost every year. Correspondingly, Ontario's total employment in manufacturing decreased by 33% from 1997 to 2012, a net job loss of 220,000 from 880,000 employees in 1997 to 660,000 employees in 2012. Figure 2 shows the downward trends in Ontario's manufacturing GDP, total employment and the manufacturing sector's share of the total provincial GDP.
Ontario's manufacturing predicament is similar to that of various other peer jurisdictions in the U.S. and Germany. Compared to these two nations Ontario exhibits the most substantial employment decreases. Between 2001 and 2011 Ontario experienced a 5.5% drop in manufacturing employment, while the U.S. and Germany dropped by 4.2% and 4.0%, respectively.[9] In terms of output, Ontario lags even further behind with an average annual decline of 5.1% between 2004 and 2009, whereas output remained relatively constant over the same period in the U.S. and Germany.

Ontario's sluggish progress in manufacturing can partly be attributed to the higher value of the Canadian dollar. A higher Canadian dollar or exchange rate, which is the value of the Canadian dollar in terms of a foreign currency, makes Canadian goods and services more expensive relative to other currency. Like any other good or service, the demand for Canadian dollars is determined by the interaction between the forces of supply and demand. A number of factors can increase the demand for the Canadian dollar, or decrease the demand for other foreign currency, therefore exerting pressure on the Canadian dollar and making it more expensive relative to other national currencies. There are a few factors that determine the Canadian exchange rate, and paramount of these is the performance of the Canadian economy. The national economy is one of the most important factors that determine the exchange rate of the Canadian dollar. A growing and strong Canadian economy makes investment in Canadian assets attractive because of the expectation of higher returns on these assets, increasing demand for the Canadian dollar and its exchange value in international markets. Other important determinants of the exchange rate include the strength of the US economy, the current account balance[10], world commodity prices, world economic growth, global stability, investment speculation and national political stability. Equally, if not more important are the differential interest rates (Canadian interest rates vs. world interest rates), unit labour costs that reflect differences in compensation and productivity between trading partners, and in the case of Canada, the relative price of oil, a major Canadian export.
These exchange rate determinants do not act in isolation of one another; they are intertwined and for the most part simultaneously impact exchange rates, so it is difficult to attribute the rise or fall in exchange rates to a single factor. Similarly, the rise in the Canadian dollar relative to the U.S. dollar is a complex phenomenon and cannot be attributed to just one or two factors. However, many economists and analysts have attributed the rise of the Canadian dollar in the past few years partly to global commodity prices such as oil. Additionally, Canada's political stability and steady economic growth in the last decade, especially in comparison to other industrialized countries during and in the aftermath of the global financial crisis in 2008, have increased the global demand of Canadian dollars and assets. Economic growth in emerging and frontier markets[11] like India, China and Brazil have increased demand for commodities, driving up their prices and exchange rates of countries which are net exporters of these commodities; countries like Canada and Australia. As a result of rising oil prices, Canada's oil exports have increased significantly and so has the value of the Canadian dollar relative to the U.S. dollar. Figure 3 shows the increasing value of the Canadian dollar is linked to the rise in crude oil prices since 2003.

A higher exchange rate with the U.S. makes Canada and its manufacturing sector less competitive. When the Canadian dollar becomes more expensive relative to the American dollar, foreign demand for Canada's goods and services decreases, and a depressed demand adversely impacts total employment and production in the manufacturing sector. Ontario's manufacturing sector has suffered as a result of the rising Canadian dollar as employment in the manufacturing sector has decreased by 33% between 1997 and 2012. Although the exchange rate is not the only determinant of competitiveness, it is an important factor. Ontario's total manufacturing output shows a similar downward trend; in 2002, it constituted 22% of the provincial GDP, but only about 13% from 2009 to 2012 and since the turn of the century, Ontario's manufacturing GDP has decreased every year on average.
Another important measure of competitiveness is unit labour cost (ULC), defined as workers nominal hourly compensation divided by their hourly productivity. ULC also takes into account the exchange rate in order to determine unit labour costs in a single currency. ULC's formula is as follows:
ULC = (Exchange Rate * workers hourly compensation in terms of their national currency) / Worker's hourly productivity.[12]
The formula above shows that a rise in the exchange rate and hourly compensation, and a decrease in hourly productivity will increase the ULC, whereas higher hourly productivity has the opposite effect. Figure 4 shows the upward swing in both Canada's ULC and Canadian exchange rate and the direct relationship between the two. Figure 5 shows that manufacturing productivity, a measure of output produced in an hour, for both U.S. and Canada in relation to Canadian exchange rate. Canadian productivity was higher than it was in the U.S. in the earlier part of this century but has been lower since 2002. Even though Canadian productivity has grown annually by an average of 1% from 2000 to 2011, U.S. productivity has increased by 6% annually for the same time period. Between 2002 and 2011, U.S. improved its productivity per hour by 56% whereas Canada's improvement was only 11%. Another determining factor in the ULC equation is the hourly wage compensation. Higher hourly wages increase ULC. From 2002 to 2011, average annual U.S. hourly compensation increase was just over 3% annually compared to 8% in Canada (in U.S. dollars). According to the US Bureau of Labour Statistics (BLS), the annual earnings in manufacturing adjusted for inflation rose by just 1.5% in Canada between 2002 and 2010, compared with 10.2% in the U.S.[13] The majority of the increase in Canada's manufacturing ULC can be attributed to exchange rates and lower productivity because the inflation-adjusted hourly wage compensation is less than that of the U.S.


Ontario's Automotive Manufacturing Sector: Industry Profile, Trends and Analysis
Automotive manufacturing is a significant part of Ontario's economy, producing light duty vehicles which includes cars, vans, pickup trucks, and heavy-duty vehicles such as trucks, transit buses, school buses, and military vehicles. Ontario also produces a wide range of parts, components and systems for these vehicles. The automotive industry in Ontario complements its manufacturing activities by maintaining a well-developed vehicle dealer network, a world class distribution system and services' provision component. Ontario is the single largest automotive jurisdiction in North America, producing one out of six cars built on the continent which employs 127,000 people directly, with an annual payroll of $8 billion. [14] Additionally, Ontario is home to 97% of Canada's automotive production, exports most of its production to the U.S., and supports about 400,000 jobs throughout the province.[15]
Ten of the world's largest automotive firms are in Ontario, including General Motors, Ford, Chrysler, Honda, and Toyota. Homegrown automotive parts' giants include Magna International, Linamar Corporation, ABC Group and the Woodbridge Group. Other notable foreign companies in the auto parts manufacturing sector include Aisin Seiki, Amino, Brose, Dana, Denso, Johnson Controls, Lear, Nemak and Wegu.[16] Over 400 companies make up Ontario's automotive sector and are located in about 60 communities in the regions of Waterloo, Durham, Windsor-Essex, and the South Western Ontario Marketing Alliance (SOMA), which includes the municipalities of Alymer, Ingersoll, Stratford, St. Thomas and Woodstock, and cities of London and Hamilton.[17] According to the Swiss Business Hub Canada, every vehicle assembly plant in Canada (10) is located in Ontario and 22% of North American vehicles (2.5 million vehicles) were produced in Ontario in 2012. Ontario's assembly plants are located in Cambridge, Woodstock, Alliston, Oshawa, Ingersoll, Brampton, Windsor and Oakville and employ approximately 43,000 employees.
Ontario's automotive manufacturing sector produced about $15.6 billion in 2012.[18] The automotive sector's GDP has been decreasing at 1% annually since 2002, and the total decrease has been about 13.5% from 2002 to 2012.[19] The automotive industry's total output decreased 33% in 2009 from 2008 in the aftermath of the 2008 financial crisis and the sectors' output decreased to $9.2 billion in 2009 from $13.6 billion in 2008. Since 2009, Ontario's automotive industry has recovered somewhat, expanding its output every year. Since Ontario exports 84% of its automotive output to the U.S, the well-being of the automotive sector is closely tied to the U.S. economy, and as the U.S. economy recovered after the recession, so did Ontario's automotive sector. Ontario increased its automotive exports by 70% from $27 Billion in 2009 to $46 billion in 2012. Even though the automotive sector has expanded since the crisis, and overall it seems to be doing reasonably well, it would be irresponsible to disregard the effects of higher unit labour costs, lower productivity and higher exchange rate on this sector. Both total employment and output have been decreasing over the last few years likely due to the aforementioned factors. The total number of employees in the automotive manufacturing sector has decreased about 13% from 1997 to 2012, an annual average decrease of approximately 1%.[20] The total transportation equipment manufacturing sector's GDP[21] decreased about 6% from 2002 to 2012.[22] It is also interesting to note that since 2009, the overall decline in both the total manufacturing and automotive manufacturing sector coincides with Ontario's lower employment rates than those of Canada for the first time since the 1980s. Figures 6 and 7 show the declining rates for both GDP and total employment in the overall manufacturing and automotive manufacturing sectors which have been coinciding with the rise in manufacturing unit labour cost and the exchange rate.


Ontario has lost some of its traditional competitive advantages. The rise of the Canadian dollar due in part to Canada's energy exports and higher global commodity prices has eroded Ontario's labour cost advantage. Lower productivity and higher unit labour costs compared to the U.S. have been detrimental to Ontario's manufacturing and exports. So has the emergence of Mexico as a serious competitor to the Canadian automotive manufacturing industry. Two new plants started automotive production in 2014, and global automakers invested about $12.5 billion in Mexico in 2010, compared to just $3.2 billion in Canada. Additionally, the hourly wage in Mexico is only $8 an hour and with additional foreign investment expected in the near future, various trade agreements, and new production plants to begin operation in the next few years, Mexico is poised to overtake Canada as the largest vehicle exporter to the U.S.[23] There have been many debates recently about the place of manufacturing in Ontario and Canada's economic policy as some commentators have labelled manufacturing a dying sector and according to some, efforts to revive manufacturing have been a waste of time and resources. However, no region can have sustainable economic growth without a robust manufacturing sector. A recent report by the Mowat Centre argues that manufacturing is a key driver of economic growth and prosperity and through its contribution to research and development (R&D), manufacturing is an important source of innovation. Furthermore, manufacturing has important backward and forward linkages to other sectors in the economy. For instance, the Centre for Spatial Economics determined a $1 billion increase in manufacturing exports would generate an additional $805 million in manufacturing GDP and create 7,779 new jobs in the sector. Through its linkages to other sectors, manufacturing would also generate an additional $1.01 billion in GDP and raise employment by 8,776 in all other sectors combined. Manufacturing is a crucial source of export revenues and in Ontario, four of the top five international exports in 2011 were from the manufacturing sector.
In Ontario, total hourly labor compensation in manufacturing has traditionally been higher than the average of all other sectors. Higher salaries further create fiscal and economic effects in regions and communities where people live and work, and all other adjoining areas. It's indisputable that the manufacturing sector has the most direct and an indirect effect on a region's economy and the only way to revitalize Ontario's manufacturing sector is by committing to increase productivity. Ontario may not be able to regain its labour costs advantage relative to the U.S. and other low cost jurisdictions especially in South East Asia or even Eastern Europe, but it can still compete globally by enhancing its other competitive advantages and increasing its productivity. Increases in productivity can be achieved only if both the public and private sectors in Ontario commit themselves to investments in machinery and equipment, and R&D. These investments should not only focus on the traditional manufacturing and automotive sector but on new emerging industries where Ontario can play a significant role and the Electric Vehicle (EV) industry is how Ontario can become one of the major players in North America. Ontario's focus on reducing its carbon footprint by committing itself to renewable energy development coupled with its strong automotive manufacturing industry makes it a great candidate to develop an EV manufacturing and R&D center. By doing this, it could enhance Ontario's position in the global manufacturing supply chain and once again establish the province as a manufacturing powerhouse in North America. The demand for EVs as a passenger vehicle and as a fleet vehicle has been on the rise as both consumers and governments have become environmentally conscious (Figure 24). Consumers are interested in EVs because operating an EV saves them money on gas, and governments are interested in curtailing their consumption and reliance on fossil fuels. Furthermore, the EV industry has made significant progress in the last few years in terms of battery advancement and improving mileage travelled, and if technology continues to improve, EVs will continue to increase their share of the auto industry. Consequently, the EV subsector could potentially be a growth sector that Ontario can stake its future on. Ontario is ideally positioned to be a leader in EV manufacturing, research and development. Exploiting its strengths in order to carve a niche in the EV industry would boost Ontario's productivity, with potential economic benefits not just for direct participants in the EV industry but for all of Ontario.
State of Ontario's Environment / Emissions
In 2011, Ontario contributed about 171 megatonnes of carbon dioxide equivalent (Mt), which is the second highest contribution of GHG emissions in Canada and almost 24% of the country's total GHG emissions for that year[24]. In an effort to reduce its emission, the Province of Ontario established three GHG reduction targets in 2007:
- 6% below 1990 levels by 2014 (to approximately 166 Mt)
- 15% below 1990 levels by 2020 (to approximately 150 Mt)
- 80% below 1990 levels by 2050 (to approximately 35 Mt)

Since Ontario set its emission targets in 2007, it has made considerable progress in reducing its carbon footprint. Ontario has successfully been able to reduce its GHG emission levels by 14.5 % from 2007 to 2011.[25] Ontario's total decrease in emissions from 1990 to 2011 has been around 3.4% but most of these reductions were the result of the closure of coal powered electricity generators. Since 2003, Ontario has been able to reduce its of coal-fired electricity generation from 25% to 0% in 2014[26]. Even though considerable success has been achieved through the closures of coal powered electricity generators, Ontario still faces several challenges if it wants to accomplish its emission objectives. One of Ontario's biggest challenges is curtailing emissions from the transportation sector, and more importantly from the road transportation sector, which constitutes the majority of emissions produced by the overall transportation sector in the province.[27]
Ontario's Road Transportation Sector:
The road transportation sector consists of the following categories: light duty gasoline vehicles, light duty gasoline trucks, heavy duty gasoline vehicles, motorcycles, light duty diesel vehicles, light duty diesel trucks, heavy duty diesel vehicles, and propane & natural gas vehicles. In 2011, the road transportation sector in Ontario emitted about 45Mt of GHGs which is about 26% of Ontario's total emissions for the year[28]. Overall, the road transportation sector experienced an increase in its emissions by 30% from 1990 to 2011. Both the transportation sector and its subsector, the road transportation sector, have increased their share of Ontario's total emissions from 1990 to 2011. Figure 9 shows Ontario's total emissions, emissions from transportation and road transportation sectors.

The biggest emission contributors in the road transportation sector are light duty gasoline vehicles (LDGV) and light duty gasoline trucks (LDGT). These two categories make up the personal transportation sector. In 2011, both LDGT and LDGV were responsible for a total of 31Mt of GHG emissions, which is almost 69% of Ontario's total road transportation emissions and 18% of Ontario's total GHG emission. Adoption of Electric Vehicles (EVs) in Ontario could be an important strategy in curbing road transportation emissions. According to the U.S. Department of Transportation, potential GHG reduction benefits per vehicle by 2030 could range from 8% to 30% for advanced conventional gasoline vehicles, 46% to 70% for plug-in hybrid electric vehicles (PHEVs), and 68% to 87% for battery electric vehicles (BEVs).[29] Since actual GHG reduction per vehicle and consequently reduction in total emissions in road transportation sector depends on electricity generation mix, the U.S. Department of Transportation assumes that the country can reduce its current average GHG intensity from 615 grams of CO2 per kWh to somewhere between 379 and 606 grams of CO2 per kWh by 2030. Since Canada's current average GHG emissions intensity of electricity generation mix (180 grams of CO2 per kWh)[30] is well below the U.S. GHG emissions intensity, emissions reduction potential from electric vehicles is even greater in Canada than in the U.S. Since Ontario's electricity generation mix is mostly composed of nuclear and hydro, EV adoption would be an important contributor in Ontario's total emission reduction.
Figure 10 below shows that road transportation's share of Ontario's total emissions increased from 20% in 1990 to 26% in 2011. In the personal transportation sector category; light duty gasoline vehicle emissions share decreased from almost 11% in 1990 to 9 % in 2011, whereas light duty gasoline trucks have increased their percentage contribution of total emissions from 4 % in 1990 to 9% in 2011, with an overall increase of 109% from 1990 to 2011.[31] It is important to understand these emission trends for both LDGT and LDGV in order to formulate and implement policies that encourage EV adoption. Understanding these emission trends and the underlying factors is important not only for EV adoption but also for overall growth of EV industry in Ontario; from R & D and manufacturing to supply and distribution.

Light Duty Gasoline Trucks and Light Duty Gasoline Vehicles: Trends and Analysis
The decrease in the emission share of light duty gasoline vehicles could be attributed to two factors: First, better combustion technology and higher emission standards; and second, to the lower percentage share of light duty gasoline vehicles. LDGTs make up a higher portion of total personal transportation stock: total of both personal vehicles and trucks. In 1990, the number of light duty gasoline trucks sold in Ontario was 1.16 million and in 2011 the sales of light duty gasoline trucks totaled almost 3 million, an increase of 156% at an annual rate of 5%.[32] In comparison, sales of light duty gasoline vehicles in Ontario have increased by only 12%, at an annual rate of approximately 1% from 1990 to 2011. These numbers demonstrate a transition away from vehicles and towards light trucks, a category which also includes vans, SUVs, and various other light trucks popular for personal transportation. Furthermore, an analysis of new sales of passenger vehicles and trucks shows that new sales of trucks surpassed sales of passenger vehicles in 2009[33]. Light duty gasoline trucks tend to be more carbon intensive than light duty gasoline vehicles, and the relatively higher number of light trucks leads to higher emissions.[34] Since 1990 the emissions per capita of LDGT have increased while the emissions per capita of LDGV have decreased for the same time period. Although light duty gasoline trucks exhibit higher emission levels in the long term they show favorable emission trends in the short term as light duty gasoline truck emissions decreased by 6 % from 2005 to 2011.
Figure 11 and 12 shows GHG emissions of light duty gasoline vehicles and light duty gasoline trucks in relation to total number of vehicles and trucks. Emissions from both light duty trucks and vehicles could be further reduced by better emission technologies, stringent regulations like the new CAFE standards, control of urban sprawl combined with smart urban development and incentivizing vehicle users to start buying EVs. Currently, there are few electric trucks to satisfy consumers with a penchant for light trucks, however, more light electric trucks will be on the market in the near future as the EV industry continues to evolve and as consumers continue their uptake of EVs.


Ontario's Emission Targets Going Forward
Emission indicators show favorable trends for Ontario. Since 2007, total GHG emissions and total GHG emissions per capita have decreased and have been less than that of Canada since 1990. Ontario's contribution to Canada's total GHG emissions has decreased in the last few years and the Province is committed to cleaner electricity generation through a favorable course to achieve its goal. Although Ontario has made significant progress in the last few years, a 2014 report by Ontario's Environmental Commissioner, Looking For Leadership the Cost of Climate Inaction, says Ontario should meet its 2014 GHG emissions commitment, however, will actual exceed its 2020 objective because of an upward trend in emissions, [35]exceeding its 2020 goal by 28Mt. Although Ontario's closure of coal generators was a very important initiative, the Province hasn't shown the necessary commitment to reduce emissions in all other relevant sectors. Unless Ontario introduces innovative policies, integrates various strategies and implements measures to reduce emissions from all other emitting sectors, Ontario may not be able to achieve its GHG emission goals.
CAFE Standards
In an attempt to make personal transportation vehicles more efficient, Canada established the Company Average Fuel Consumption (CAFC) targets in 1974. Initially these targets were voluntary for auto manufacturers, but in 2007 Canada implemented the Motor Vehicle Fuel Consumption Standards Act (MVFCSA) making these voluntary targets mandatory.[36] In 2010, the CAFC program was replaced by the Passenger Automobile and Light Truck Greenhouse Gas Emission Regulations in an attempt to reduce greenhouse gas emissions from the automotive sector. These regulations were finalized in October 2010 and limited GHG emissions on passenger cars and light duty trucks from 2011 to 2016.
In late 2012, Environment Canada proposed Regulations Amending the Passenger Automobile and Light Truck Greenhouse Gas Emission Regulations for 2017 to 2025 in alignment with the United States Corporate Average Fuel Economy (CAFE) Standards.[37] The new standards, created in 2009 following an announcement by President Barack Obama, takes an aggressive approach to reducing fuel consumption and GHG emissions from light duty passenger vehicles and light duty trucks.
Manufacturers are forced to meet the CAFE required levels which are dependent on vehicle size and have taken several approaches to meet the new mandatory standards, or risk being fined for their lack of compliance. In an effort to meet these standards, automakers are making more fuel efficient engines, adopting hybrid and electric technologies and using more lightweight materials such as aluminum, titanium and advanced high-strength steel over the traditional steel and iron.
Below is the chart which outlines the CAFE Standards for each year from 2012 to 2025. What is interesting is the fuel economy standards for light duty trucks are not as aggressive as those for passenger cars. It could be argued that if automakers were forced to find and incorporate technology into these trucks to match the increase in fuel economy to that of passenger cars, trucks would be so expensive the average Ontarian could not afford them. Considering truck sales have grown to surpass light duty passenger vehicles in Canada, this would be bad for business for automakers that rely heavily on truck sales.

2017 to 2025 Model Year Light-Duty Vehicle GHG Emissions and CAFE Standards: Supplemental
Manufacturing and Operational Emissions: Electric vs. Gasoline Vehicles
Accounting for total emissions generated by gasoline vs. electric vehicles should include both the manufacturing and operational emissions. Indeed there will be major reductions in emissions associated with the use EVs instead of gasoline cars but the expansion of production of EVs generates new emissions that need to be compared to those of manufacturing gasoline vehicles. The issue is not simply to highlight the emission savings inherent in using electric vehicles in lieu of gasoline vehicles but to assess whether or not total emissions are reduced when manufacturing of vehicles and electricity generation are also included. Our report and the Getting To 80 Calculator Tool only review the emission from operating the vehicles.
Total emissions are generated by a complex set of activities. First, there are the direct reductions in emissions that are associated with the substitution of gasoline vehicles with EVs. Second, the generation of the additional electricity to operate EVs will generate new pollution depending on how this electricity is produced. For example, hydro generation emissions are significantly less than coal or natural gas based generation. Third, the manufacturing of new EVs adds to emissions and the elimination of gasoline cars' manufacturing will reduce emissions.
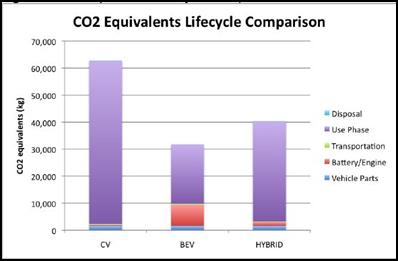
To assess the overall emission impacts of switching from ICEs to EVs, a full life cycle assessment needs to be conducted. There are several studies which have tackled this issue and the results are in favour of EVs. One such study was published by RICARDO-AEA, an international environmental and energy consulting company. Their analysis considered the lifecycle emissions for various technologies to provide estimates from the current situation in the UK out to 2050. They conducted a wide literature review and categorized the lifecycle into 5 main areas, vehicle manufacture, transport, operation, refuelling infrastructure and end of life disposal. The report investigated the influence of key geographical parameters on overall emissions, separated the emissions into UK and non-UK emissions, and explored the sensitivities for key components and scenarios on how these emissions might be reduced. What they found was that there were principal differences on how each stage was measured and the units of measurement used. For example, some areas which differed were the lifetime of the vehicle in kilometres and the assumptions used around the GHG intensity to manufacture EV batteries. [38] Overall, there was a consensus that EVs do produce slightly higher emissions during the manufacturing phase, but they do offer significantly less emissions during operations, offering around 77% to 89% emission reductions compared to ICEs in the year 2050.[39] The reason being is that the majority of emissions from the manufacturing phase are the result of making the batteries. This is anticipated to decrease over time as EVs increase in volume, battery manufacturing becomes more localized and battery energy density improves thus reducing the amount of materials needed.[40]
A California based research paper from the University of California, Los Angeles also highlights that the majority of the energy intensity in the lifecycle of a vehicle is a result of operating the vehicle, up to 95% of the lifecycle energy in an LDGV and 74% in a BEV over the vehicle lifetime.[41] This research paper also concurs that battery manufacturing contributes significantly to the lifetime energy requirements, at around 19% for a BEV, noting that vehicle parts manufacturing, transportation, and disposal are not significant to the overall lifecycle energy inputs of a BEV.[42] The figure above demonstrates the base case of emissions produced over the entire lifecycle of the vehicles (measured in CO2 equivalents), reveals that a CV (ICE) produces 62,866 kg CO2 equivalents, a BEV produces 31, 821 kg CO2 equivalents, and a hybrid produces 40,773 kg CO2 equivalents.[43] Overall they conclude that BEV have the least environmental impact, but do reiterate that the impacts from BEV rely heavily on the battery manufacturing electricity supply mix in the operating phase. Their sensitivity analysis of electricity mix dependency shows that California's electricity mix with 33% renewables, is the most energy efficient and the least polluting, resulting in an approximate decrease of 20% for both BEV emission and energy intensity.[44]
Additional studies have also claimed an overall decrease in emissions or global warming potential with the transition from ICEs to EVs. One study is the Comparative Environmental Life Cycle Assessment of Conventional and Electric Vehicles in the Journal of Industrial Ecology. Their calculations are not as optimistic as the previous source, but they do still offer reductions in emissions in their operational phase. This study suggests that EVs offer lower emissions during the use phase but the supply chains involved in the production of electric powertrains and traction batteries is more environmentally intensive, not just through emissions but including other environmental impact categories like mineral depletion.[45] For some environmental impact categories, Hawkins et al. reveal that lower emissions during the use phase compensate for the additional burden caused during the production phase of EVs, but this depends on the electricity mix.[46] It highlights that on the one hand: EVs would aggregate emissions at a few point sources (power plants, mines, etc.) instead of millions of mobile sources, making it conceptually easier to control and optimize societies' transportation systems.
On the other hand: The indirect nature of these emissions — which are embodied in internationally traded commodities such as copper, nickel, and electricity — challenges us as a society.
It poses the question of how serious are we about life cycle thinking, and how much control and oversight we, customers, and policy makers believe should be exerted across production chains.[47]
Overall, these various lifecycle assessments tell us that EVs offer emission reductions in the operational phase of the vehicle, compared to an ICE. They also tell us that where batteries are manufactured and how long they last have a significant impact on the emission reduction potential of EVs versus ICEs. When the Province is designing and encouraging EV adoption policies, it is critical that Ontario considers; manufacturing the battery components locally, supporting research and development to increase battery efficiency, additional environmental impacts (such as impacts from mining and toxicity) and ensuring that Ontario's electricity supply mix consists of emission free energy.
Ontario's Emission Intensity
As manufacturing of EVs increase our economy will experience a positive increase through job creation and a rise in GDP. The figure below shows that Ontario's emission intensity, which is calucuated by dividing total GHG emissions by GDP, decreased from 0.63 in 1990 to 0.28 in 2011. Traditionally, there has been a strong link between GDP and GHG emissions. GHG emissions are expected to increase with an increasing GDP. Ontatio's GDP increased more than 116% but GHG emissions from 1990 to 2010 decreased around 1.7%. This decoupling of GDP growth and emissions is the result of efficiency, technological growth and structural changes.


Ontario is also in a position to generate electricity from renewable and other low emission sources in order to drastically reduce the emissions which are a result of manufacturing vehicles. As a result this will create more opportunities for positive economic and employment impacts in the creation of emission free energy in the province. Again, the model used assumed all vehicles would be made in Ontario, thus the province would bear the brunt of the manufacturing emissions. Realistically, Ontario will not manufacture all the vehicles driven in the province. A balance needs to be reached; weighing the cost benefit of gaining economic impacts and reducing emissions.
Current State of Power Generation in Ontario
Ontario has an installed power generation capacity of 32,961 megawatts (MW). Nuclear and natural gas generation makes up the majority of the supply mix and Figure 14 shows Ontario's energy generation supply mix. Ontario has been increasing its nuclear power, natural gas and renewable energy power generation steadily for the last few years while maintaining the share of hydro power in the total supply mix.


From 2003 to 2011, Ontario has been able to reduce about 90% of coal fired electricity generation. Between 1990 and 2011, Ontario increased its electricity production from nuclear, natural gas and renewable resources. It produced 59,400 GWh of electricity through nuclear sources in 1990 and 84,800 GWh in 2011, representing an increase of 42.7% from 1990 to 2011. Ontario's natural gas electricity generation increased from 3.2 GWh in 1990 to 20,600 GWh in 2011. Ontario went from generating no electricity through non-hydro renewables in 1990 to producing 3,420 GWh of electricity in 2011.[48]
According to Ontario's long term energy plan, it is in a supply surplus and anticipates lower than expected demand in the coming years as the Province continues its transition to energy efficient and less energy intensive future. Ontario is committed to meeting its future energy demands by increasing the share of non-hydro renewables in its supply mix. Ontario's planned supply mix for non-hydro renewables in 2013 was 826 MW and it is 1,083 MW for 2014 and represent shares of 2.57% and 3.70%, respectively[49]. Figure 17 below illustrates Ontario's planned supply mix for 2013 and 2014 and shows nuclear, hydro, natural gas and non-hydro renewables sources are expected to produce more electricity in 2014.

Base load Generation: Nuclear and Hydro
Nuclear and hydro generators provide steady output also known as the base load generation. Nuclear power has been the main provider of energy in Ontario for more than four decades and it provides more energy than all other electricity generating sources combined consisting of 13,000 MW of installed nuclear capacity. Ontario has three nuclear power sites: Pickering Nuclear Generating Station (GS), Darlington Nuclear GS, and Bruce Nuclear GS, which is the largest nuclear facility in the world. Each site uses Canadian-developed CANDU nuclear reactors, 18 of which are currently in operation. Following nuclear sources, hydroelectric facilities are the second largest contributor to the provincial power grid. Ontario has approximately 8,000 MW of installed hydroelectric capacity. The highest producing stations are the Sir Adam Beck GS on the Niagara River, the Saunders Power Dam on the St. Lawrence River, and Des Joachims GS on the Ottawa River. Ontario's north is also home to numerous hydroelectric stations, such as the Aubrey Falls and Wells stations on the Mississagi River near Sault Ste. Marie.[50]
Peaking and Intermediate Generation: Hydroelectric and Natural Gas
Both hydroelectric generators with reservoirs and natural gas facilities are able to ramp up production in response to demand increases. They can also be relied on in case of emergencies such as a temporary shutdown of a reactor. Gas generators can be limited in their response because they have to be operated for a minimum amount of time before they are able to vary their output, whereas hydroelectric generators have the ability to respond faster to fulfill any demand variations. Natural gas has approximately 10,000 MW of installed capacity. Natural gas generators continue to expand their role as the provinces downsizes its coal generators.
Variable Energy Generation: Wind and Solar
Ontario currently has an installed wind capacity of 1,700 MW, and expects to add an additional 2,000 MW to the grid in 2014. Solar generation production ranges from small scale operations by farmers, local businesses or homeowners to larger operations like the 97 MW Sarnia photovoltaic power plant[51]. Both these sources produce variable outputs and complement each other. Solar generators produce higher yields mostly during midday and this makes them particularly important during summer months, especially during peak days with high air conditioner usage. Wind generators produce higher yields in the winter and during the night. Both solar and wind sources are flexible within limits of availability of the wind, and are able to change output very quickly in response to system needs and demand requirements. Furthermore, wind and solar also provide the small scale generation in order to reduce the energy generation required from the grid, and consequently relieve congestion along transmission lines and reduce line losses. Solar and wind facilities located in the service territories of local distribution companies are estimated to reach 2,500 megawatts (MW) by May 2015. As of October 2013, more than 1,200 MW of new solar and wind generation was produced to off-set local energy needs[52].
Other Arrangements: Interconnectedness, import and exports, biomass, embedded variable generation
Ontario's electricity grid is part of a greater network that spans North America. These connections provide reliability and fall back options as needed. If a local generator fails, power automatically flows in from Ontario's neighbours, which are other provinces and states in the U.S., to help cover the few minutes it takes to get another Ontario-based generator up and running.[53] Ontario also imports and exports energy as per its requirements. Additionally, Ontario has been making inroads in biomass energy generation and plans to convert both the Thunder Bay and former Atikokan coal generating stations to biomass facilities. The province has about 100MW in biomass generating capacity.
Transmission, Local Distribution Companies (LDC) and Planning Regions:
There are over 30,000 kilometers of transmission lines in Ontario, and the IESO controlled grid includes 115 kilovolt (kV), 230 kV, and 500 kV transmission lines that span the province. Local distribution companies (LDC) operate the low-voltage grid to deliver power to 4.9 million consumers. Furthermore, The Ontario Power Authority conducts regional planning in about 21 planning regions[54].
Ontario's Long Term Energy Plan
According to the Province, Ontario's 2013 Long Term Energy Plan (LTEP) is designed to be pragmatic and flexible. The plan incorporates the principles of cost-effectiveness, reliability, clean energy, community engagement, conservation and demand management. This section provides a summary of the LTEP released 2014.
Ontario has adopted a policy of conservation first which focuses on rate mitigation over major investments in generation or transmission to curb the cost to rate payers. Ontario will also plan for a lower demand scenario with the ability and flexibility to adjust for any potential demand changes. The Ontario energy report is scheduled to be released annually starting in 2014 providing the public with updates and progress on the energy plan. The LTEP will also be reviewed every three years to ensure residential, commercial and industrial demands of the province are met. During this time Ontario will continue to invest in various renewable energy generation options and will explore storage technology options. The refurbishment of the Bruce and Darlington sites will go ahead as planned and Ontario will continue its collaboration with local distribution companies, local communities and various agencies to ensure efficiency and savings.
Role of Conservation
Conversation options will continue to play a very significant role in Ontario's energy strategy. The Province is committed to employ the policy of conservation first and it continues to evaluate all conservation options in its planning, approval and procurement processes. Ontario's long term conservation target of 30 terawatt-hours (TWh) in 2032 represents a 16% reduction in the gross demand for electricity, an improvement over the 2010 LTEP. Moreover, Ontario plans on utilizing Demand Response (DR) to meet a 10% of peak demand by 2025, equivalent to approximately 2,400 megawatts (MW) under current forecast conditions. The Province will continue to evolve existing DR programs and introduce various consumer initiatives. Figure 18 below shows the expected role of various sources in energy production both in 2013 and 2032. As shown, conservation strategies are expected to produce 16% of energy generation in 2032, up from 5% in 2013. Figure 19 shows annual energy savings through a combination of various energy efficiency and savings programs are expected to increase every year and reach 60 TWh in 2032.


Nuclear Energy
Nuclear energy will still be an important source of energy generation for Ontario. The province's nuclear generating stations at Darlington, Bruce and Pickering have historically provided half of the province's electricity supply. The province will not need to build additional nuclear capacity but plans to refurbish units at the Darlington and Bruce Generating Stations with the potential to renew 8,500 MW over 16 years. Both Darlington and Bruce stations plan to begin refurbishing one unit each in 2016. Figure 20 shows the percentage share of all resources from 2013 to 2032 according to LTEP, even though nuclear energy's share would drop from 57% in 2013 to 43% in 2032, it would still be a major source of power generation.

Renewable Energy
Ontario is a leader in renewable energy in North America. At present, Ontario has 18,500 MW of renewable energy online or announced, including more than 9,000 MW of hydroelectric capacity and more than 9,500 MW of solar, wind and bioenergy capacity. Ontario is also experimenting with biomass energy generation. Ontario currently has 2,300 MW of wind power online, which is expected to produce electricity each year to power more than 6,000 homes.
Ontario has the most photovoltaic (PV) capacity of any other jurisdiction in Canada. It has 900 MW of generating capacity online and is expected to produce enough electricity for more than 100,000 homes annually. Hydroelectricity has played a very important role in Ontario's power generation. More than half of Ontario's renewable energy comes from hydroelectric plants that provide more than 20% of the province's electricity. The province's hydroelectric resources generated the energy to power approximately 3.5 million homes in 2012 and it will continue to play a significant role in Ontario's diverse supply mix. The province has over 8,000 MW of water power in service and enough projects contracted and under development to meet the 2010 LTEP target of 9,000 MW of installed hydroelectric capacity by 2018. Ontario's goal is to increase its hydroelectric generating capacity to 9,300 MW by 2025.
Natural gas remains an important component of Ontario's energy generation. There are approximately 3.5 million residential, commercial and industrial natural gas customers in Ontario, and provides 15% of the electricity in Ontario. However, the provincial government is not planning to add new capacity or renew additional contracts to fill province-wide needs. Natural gas is operationally very cost-effective and can be dispatched very quickly to fulfill demand requirements. Figure 21 below shows Ontario's energy generation by resource for both 2013 and 2025 and shows that the share of solar, wind, bioenergy and hydro in power generation would increase to reach 46% by 2025.

Additionally, Ontario has many interconnections with various other jurisdictions such as Manitoba, Quebec, Minnesota, Michigan and New York. In total, Ontario has about 4500 to 5200 MW of import-export capacity.
Investments in Transmission
Maintenance of the transmission lines is important to ensure reliability of the grid. Ontario's existing transmission system and projects in progress are sufficient to meet the LTEP targets. To facilitate mining activities in Northern Ontario and other parts of the province various transmission development projects are underway, and the total investments in transmission and distribution projects across Ontario could exceed $2 billion in the next few decades. In other regions across Ontario, old transmission and distribution assets are in the process of being revamped or replaced. Figure 22 below shows Ontario's capacity contribution as time of peak demand.

Ontario's Planning Regions:
Ontario has 21 electricity regions developed for regional planning purposes. The boundaries were set by considering common supply systems, electrical interrelationships, shared supply and system performance impacts in the OEB's Renewed Regulatory Framework for Electricity.
EVs and Ontario's Long Term Energy Plan
Ontario's Long Term Energy Plan (LTEP) has incorporated electrification of transportation in its demand forecasts. LTEP's forecasted load is based on analyses and studies from various sources and contains projections of battery electric vehicles and plug-in hybrid electric vehicles, driving patterns, and charging characteristics[55]. LTEP incorporates combined EVs and GO transit electrification in its analysis; however, it doesn't include EVs as a separate category. GO transit electrification demand forecast is based on the analysis discussed in Metrolinx 2011 GO Electrification Study. The GO transit electrification forecast assumes that the Air Rail Link will be implemented in 2018 and the Georgetown and Lakeshore corridors will be electrified between 2026 and 2031. LTEP forecasts to add approximately 20GWh in 2020 and 170 GWh in 2030[56]. LTEP assumes 5% EVs (400,000) out of total vehicles in 2020 and 11% (1 million) out of total vehicles in 2031. Figure 23 shows demand forecasts for various sectors and the demand forecast for electrification of EV and GO transit is expected to reach 3.6 TWh in 2032.

The update of EVs could vary significantly depending on various factors that impact its uptake. Although the province may possess more than adequate energy capacity to meet its electrification demands, challenges can be expected more so in specific regions where EV uptake increases substantially. Power plants and transmission lines may have sufficient overall capacity, however problems could arise when excess power needs to be distributed to neighbourhoods. Charging an EV could be equivalent to adding three quarters to three houses to a grid,[57] and an unplanned increase in the number of EVs in a neighbourhood could strain the regional distribution system. EVs have the potential to form EV clusters, where people with a certain level of income, or certain lifestyles tend to live. These clusters exist in Silicon Valley and Santa Monica in the US. With the increase in EV uptake in different neighbourhoods across Ontario power distribution could be a challenge. Any increase in electricity demand as a result of EV uptake in neighbourhoods would be fulfilled by the supply mix outlined in LTEP report. Nuclear and hydro would continue to provide a majority of base load electricity with the other sources, namely natural gas, hydro, and non-hydro renewables filling in when necessary. Some sources might be more relevant than others depending on regional requirements and regional transmission and distribution infrastructure. In LTEP, commercial, residential and industrial intensities are forecasted to continue to decrease, these intensities may be higher than average in certain regions where EV uptakes are higher than forecasted and may strain the transmission and distribution networks in these neighbourhoods. Ontario has 21 planning regions, the OPA, Ontario Ministry of Energy, IESO, and all regional stakeholders continue their collaboration in energy planning and distribution activities in these regions to ensure reliable energy production and distribution to Ontarians. Determining specifications of demand and impacts on transmission and distribution in neighbourhoods is beyond the scope of the WEC's Report, however, it is an area where further research endeavors could be beneficial to the province.
Current EV Profile in Ontario
Ontario is home to 10 automotive assembly plants and over 300 independent parts manufacturers. Together they employ over 88,000 people. Currently the majority of cars purchased or produced in Ontario are of the conventional type. The only EV manufacturing facility is Toyota's manufacturing plant in Woodstock, Ontario. This plant is Toyota's highest-producing plant in North America and second largest plant worldwide. The plant produced its first RAV4 EV in May 2012 and total production at the plant rose from 78,000 in 2009 to 178,000 in 2012 — a big part of Toyota Motor Manufacturing Canada's (TMMC) total production increase of 43.5 percent in a single year.[58]
The number of registered Plug-In Electric Vehicles[59] in Canada is currently small but the sales numbers are on the rise. According to R.L.Polk Data, PHEV sales increased about 51%, and BEV sales increased about 25% in Canada from March 2013 to March 2014. The Ontario Government is on record supporting the development of green jobs and a green economy and has conducted many studies on the impact that EVs will have on the province's electricity transmission and distribution grid, like Towards an Ontario Action Plan for Plug-In Electric Vehicles. However, there is currently no comprehensive work being done to assess the full economic impact of EV adoption and its implications for the current and future labour market in Ontario. As the new car industry comes on stream and higher electricity production and distribution systems like charging stations become required, it could have major implications for the labour market and demand for skills. A highly skilled and very knowledgeable labour force in Ontario will be needed to support and sustain the transition to the new green economy. Figure 24 shows Canadian vehicle sales by type in 2012.
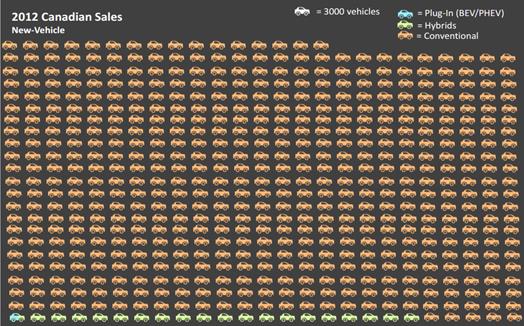
Figure 25 shows the number of BEVs and PHEVs for the Canadian provinces with the highest number of plug in vehicles. As shown, there has been a significant increase in BEVs from 2012 to 2013 in British Columbia, Quebec and Ontario; the number of BEVs in Ontario increased by 249% from 2012 to 2013. This upward trend in both PHEVs and BEVs is expected to continue for the foreseeable future not just in Ontario but across Canada.


The number of existing charging stations in Canada is provided in Table 1. Given the fragmentation of the information it is almost certain there are missing stations; however, the numbers below are believed to represent the best aggregation of the Canadian charging station locations currently available. As can be seen from the results in Figure 26, Quebec has the largest number of EVSE heads, while British Columbia has the most EVSE locations. In comparison to the number of plug-in vehicles currently on the roads in Canada, each charging station on average can accommodate about 3.5 plug-in hybrid vehicles for a charge, whereas in the US, each charging station could accommodate 3 plug-in vehicles for a charge. Ontario has improved at establishing charging locations although it has been lagging behind B.C. and Quebec.
Ontario's EV industry supply chain comprises of five categories[60]: charging infrastructure, chargers, batteries, motors and controllers, and vehicle manufacturers. In the battery category, Ontario is home to a cutting edge battery technology firm called Electrovaya. The Mississauga-based company has more than 150 patents and designs, develops and manufactures proprietary Lithium Ion batteries, battery systems and various battery-related products for clean technology, smart grid power, consumer and health care markets.[61] Vecture Inc.[62] is a battery management company that provides industry leading design, manufacturing, test and supply chain solutions for battery management systems. BET services is another reputable Ontario-based company that provides battery testing services for OEM (original equipment manufacturers) and their original tier 1 and tier 2 suppliers.[63] In both motors and controller, and vehicle manufacture categories, an Ontario company called Azure Dynamics Corporation is a world leader in the development and production of hybrid electric and electric components and powertrain systems for commercial vehicles[64], its principal business. Furthermore, Magna International, which is an Ontario-based automotive conglomerate, is a leader in the supply of hybrid and electric vehicle (H/EV) components, systems and engineering services to the automotive industry. Magna international engages in EV and hybrid vehicle component support and engineering services through its subsidiaries Magna E-car Systems, Magna Power Train, and Magna Steyr. [65] Ontario is also home to diverse and innovative companies such as Cross Chasm, FleetCarma, Inertia Engineering that provide product design, engineering and data analysis services to the EV industry. [66] With the increased uptake in BEVs and PHEVs, Ontario's auto industry and EV industry supply chain is expected to increase their activities, and as the centre of Canada's automotive manufacturing centre, Ontario is a great testing ground to determine and understand the effects of higher EV adoption rates.
C. Potential Economic Impacts of EV Adoption in Ontario
Introduction
The economic literature review in Section B discusses seven economic studies that analyzed the impacts of electric vehicle adoption and the electric vehicle industry in European Union (EU) countries, Austria, and in the United States (U.S.), particularly in the states of Oregon and California and the greater Cleveland, Ohio area. These studies suggest positive economic impacts of higher electric adoption. Windfall Ecology Centre worked with Econometric Research Limited (ERL) to identify and quantify the economic and labour market impacts of introducing electric vehicles as a replacement for gasoline vehicles in Ontario. ERL conducted a detailed empirical analysis to understand, analyze and determine the economic effect of higher EV adoption in Ontario, and did so in three categories: manufacturing, operations and infrastructure development. The effects of manufacturing gasoline vehicles and EVs were analyzed independently and the net result of the two was taken as the overall effect of EV manufacturing in Ontario. The technologies used to produce gasoline and electric vehicles have certain similarities, but also have some significant differences. Gasoline cars are predominately made of metal products whereas EVs use more electrical and computer-based products. Because of this, differences in economic and labour market impacts are created.
Methodology and Approach
Referred to as the economic multiplier effect, A dollar spent on the manufacturing, installation, operation and maintenance of Plug-In Electric Vehicles on wages or supplies circulates and re-circulates within the economy, multiplying the effects of the original expenditures on overall economic activity. This process operates at several levels:
- The initial expenditures on wages and materials are generally referred to as the direct costs of the program and their effects are referred to as the initial (direct) effects.
- Subsequent purchases by suppliers of materials and services to sustain the original and derivative expenditures are called the indirect effects.
- The induced effects emerge when workers in the sectors stimulated by initial and indirect expenditures spend their additional incomes on consumer goods and services.
Economic impact analysis is a useful mathematical tool capable of quantifying the patterns and magnitudes of interdependence among sectors and activities. It is predicated on two fundamental propositions:
- Regardless of the inherent value of primary activities such as conservation of natural resources and the protection of the environment, to the extent that activity involves the use of scarce resources it generates economic consequences that can be measured and compared.
- Economic impacts are only partially captured by assessing direct expenditures. The economy is a complex whole of interdependent and interacting activities, and there are a number of significant indirect and induced impacts associated with direct expenditures. These indirect and induced impacts can often be larger than the direct impacts.
For the purpose of its research, ERL only incorporated permanent and sustainable jobs in its analysis. Jobs that result from operational expenditures are sustainable and permanent in nature where as some of the jobs that result from capital expenditures such as construction, development and infrastructure expenditures may not be. Economic impact was based on the assumption that 100% of vehicles adopted in Ontario would be made in Ontario. This sets a case for a strong and continued automotive manufacturing hub in Ontario. Economic impacts do not consider that over 80% of automobiles and parts get exported to the United States.
Gross and Net Impacts
Electric Vehicles generate savings as a result of reduced gasoline consumption and these savings end up as additional expendable income on goods and services. The net impacts are typically the net result of negative impacts and positive impacts. In the case of PEVs, the net impacts are specifically the sum of the positive impacts of producing electric vehicles, the supporting infrastructure (capital and operational expenditures), and the avoided cost. The negative impacts that would arise are the decline in conventional car production, phasing out of the conventional car supporting infrastructure and the decline in the consumption in gasoline.
Overall, positive net impacts of EVs are expected and are likely to be concentrated in higher value added and higher levels of employment. It is equally possible that there will be positive net gains in all taxes and revenues at all three levels of government and in wages and salaries. All of these net impacts are determined by quantitative estimations using the impact model.
Shares of Electric Vehicles in Total Ontario Passenger Fleet
For the purpose of this report, four growth scenarios for the stock of light duty gasoline vehicles (LDGVs) and light duty gasoline trucks (LDGTs) for 2025 and 2050, respectively, were produced. We decided on a 1% annual growth scenario for LDGVs and 2% growth scenario for LDGTs because it was deemed these two scenarios most resemble a business as usual
case. According to the scenarios, LDGVs will rise to 6.8 million and LDGTs are expected to exceed 6.4 million by 2050. To determine more realistic growth projections for the number of passenger vehicles and trucks, ERL used a logistical curve which allows for faster growth in the first few years and slower growth in the later years. Based on the logistical growth curve analysis the number of LDGVs for 2025 is projected to be 5,173,924 and 5,886,834 for 2050.
While the study looks at the growth rate of LDGTs in the overall vehicle population, the adoption of electric propulsion in this segment is not considered in the static economic impact scenarios presented below. However, scenario simulations for both LDGVs and LDGTs may be modelled in Windfall Centre's dynamic Getting to 80 (GT80) Calculator for personal transportation.
In order to develop baseline data for this report and for the GT80 Calculator two EV adoption scenarios were constructed. The scenarios consider the impact of electric vehicles on Ontario's economy where 5% of all LDGVs are Electric Vehicles and where 10% of all LDGVs are Electric Vehicles. The GT80 Calculator extrapolates the findings to allow dynamic scenario explorations.

Using the average LDGV retail price, the total expenditures on gasoline cars was determined. The same number of gasoline cars is slated to be replaced by EVs at an average price that is $7,500 higher (which is the mid-point of the price range between $4,000 and $11,000).
The inputs in Table 2 drive the impact results of the next section. All impacts involve phasing out gasoline cars and replacing them with locally produced EVs (impacts of gasoline car production are subtracted from the impacts of manufacturing an equivalent number of EVs).
Economic Impacts of Manufacturing Gasoline Vehicles
The economic impact of manufacturing gasoline vehicles is estimated by ERL using their proprietary Social Economic Impact Model. The number of gasoline cars expected in 2025 and 2050 that are subject to replacement by EVs (for the 5% and 10% scenarios) were assumed to be produced by the same technology used today to manufacture gasoline cars. Both Table 3 and Figure 27 show the economic impacts of manufacturing gasoline vehicles: Figure 27 shows tax impacts based on the 5% scenario in 2025 and 2050 and Table 4 shows tax impacts under the same four scenarios. Employment impacts are discussed in more detail in section E of this report. The following impacts can be expected for the 5% scenario in 2025:
- When direct, indirect and induced impacts are added together, the total income impact of manufacturing 5% of the expected vehicles in 2025 in Ontario exceeds $7.7 billion (Table 3 and Figure 27).
- A total of 81,371 person years (full-time equivalents) of employment are sustained in Ontario by the manufacturing of these vehicles (see Table 3). This employment is sustained by a high volume of manufacturing expenditures on inputs that exceed $16 billion in Ontario.
- More than 39,997 Ontarians owe their direct full-time equivalent employment to these activities.
- The effective wages and salaries sustained by these expenditures are relatively high. The direct effective wage is over $58,260 and the total effective wage is higher at $62,419.
- All levels of government derive large streams of revenues from the economic impact of gasoline vehicle manufacturing. The total tax revenues of all three levels of government exceeds $2.2 billion with the federal government collecting $1.1 billion, the provincial government about $875 million and local governments a total of $291 million (Tables 3 and 4).
- Personal income taxes are the major revenues for both the federal ($693 million) and provincial governments ($418 million). This is followed for both levels of government by the Harmonized Sales Tax (HST): The federal government collects $197 million, whereas the provincial government collects a higher share of $315 million (Figure 28 and Table 4).
The economic impacts for the 10% scenario in 2025 are simply twice as large as those of the 5% scenario. For the 5% share of gasoline cars in 2050, the following impacts are expected:
- The total income impact of manufacturing 5% of the expected vehicles in 2050 in Ontario exceeds $8.6 billion (Table 3 and Figure 28).
- A total of 92,269 person years (full-time equivalents) of employment are sustained in Ontario by the manufacturing of these vehicles (see Table 3). This employment is sustained by a high volume of manufacturing expenditures on inputs of about $18.2 billion in Ontario.
- More than 45,354 Ontarians owe their direct full-time equivalent employment to these activities.
- The effective wages and salaries sustained by these expenditures are relatively high. The direct effective wage is over $58,259 and the total effective wage is higher at $62,420.
- All levels of government derive large streams of revenues on the economic impacts of gasoline vehicle manufacturing. The total tax revenues of all three levels of government exceeded $2.5 billion with the federal government collecting $1.3 billion, the provincial government about $992 million and local governments a total of $330 million (Tables 3 and 4).
- Personal income taxes are the major revenues for both the federal ($786 million) and the provincial governments ($474 million). This is followed for both levels of government by the Harmonized Sales Tax (HST). The federal government collects $223 million whereas the provincial government collects a higher share of $358 million (Table 4).
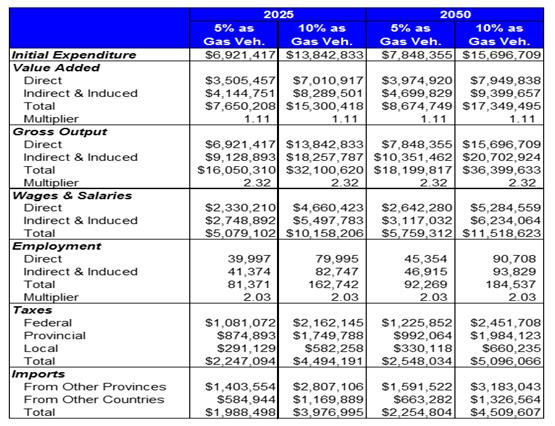

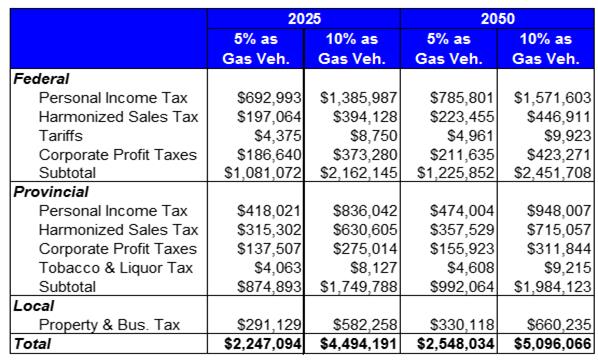

The Economic Impacts of Manufacturing Electric Vehicles
A significantly different impact profile emerges when electric vehicles manufacturing replaces gasoline vehicles. Tables 5 and 6, and Figures 29 and 30 show economic and tax impacts of both 5% and 10% scenarios for 2025 and 2050.The following impacts are expected:
- When direct, indirect and induced impacts are added together, the total income of manufacturing 5% of the expected vehicles in 2025 in Ontario exceeds $9.4 billion (Table 5 and Figure 29).
- A total of 98,538 person years (full-time equivalents) of employment are sustained in Ontario by the manufacturing of these vehicles (Table 5). This employment is sustained by a high volume of manufacturing expenditures on inputs that exceed $20.4 billion in Ontario.
- More than 46,179 Ontarians owe their direct full-time equivalent employment to these activities.
- The effective wages and salaries sustained by these expenditures are relatively high. The direct effective wage is over $61,757 and the total effective wage is higher at $64,216.
- All levels of government derive large streams of revenues on the economic impacts of electric vehicle manufacturing. The total tax revenues of all three levels of government are about $2.8 billion with the federal government collecting $1.3 billion, the provincial government about $1.1 billion and local governments a total of $362 million (see Tables 5 and 6).
- Personal income taxes are the major revenues for both the federal ($865 million) and the provincial governments ($522 million). This is followed for both levels of government by the Harmonized Sales Tax (HST): The federal government collects $244 million whereas the provincial government collects a higher share of $391 million (Table 6)
The economic impacts for the 10% scenario in 2025 are simply twice as large as those of the 5% scenario. For the 5% share of electric vehicles in 2050, the following impacts are expected:
- The total income impact of manufacturing 5% of the expected vehicles in 2050 in Ontario exceeds $10.7 billion (Table 5 and Figure 29).
- A total of 111,735 person years (full-time equivalents) of employment are sustained in Ontario by the manufacturing of these vehicles (see Table 5). This employment is sustained by a high volume of manufacturing expenditures on inputs of about $23.2 billion in Ontario.
- More than 52,563 Ontarians owe their direct full-time equivalent employment to these activities.
- The effective wages and salaries sustained by these expenditures are relatively high. The direct effective wage is over $61,757 and the total effective wage is higher at $64,216.
- All levels of government derive large streams of revenues on the economic impacts of electric vehicle manufacturing. The total tax revenues of all three levels of government exceeded $3.1 billion with the federal government collecting $1.5 billion, the provincial government about $1.2 billion and local governments a total of $410 million (Tables 5 and 6).
- Personal income taxes are the major revenues for both the federal ($981 million) and the provincial governments ($592 million). This is followed for both levels of government by the Harmonized Sales Tax (HST): The federal government collects $277 million whereas the provincial government collects a higher share of $444 million (Table 5 and Figure 30)
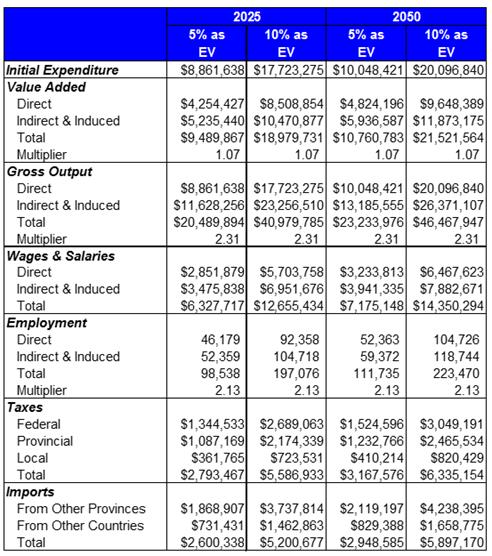


The Net Economic Impacts of Manufacturing Electric Vehicles
As mentioned earlier in this section, the net effect of manufacturing EVs is calculated by subtracting the impact of manufacturing gasoline vehicles from the impact of manufacturing electric vehicles. Table 7 shows net economic impacts of manufacturing EVs and Table 8 shows differential tax impacts of manufacturing gasoline vehicles versus electric vehicles. Figure 31 shows the net economic impacts of manufacturing EVs for both the 5% and 10% scenarios in 2025 and 2050, and Figures 32 through 35 shows the comparison of economic impacts of manufacturing gasoline vehicles versus EVs, and their net or differential impacts based on the four scenarios outlined above. The substitution of electric vehicles for gasoline vehicles results in higher impacts across the board. Of special significance are the following differential impacts in 2025:
- Total income increases by over $1.8 billion for the 5% share scenario in 2025. (Table 7 and Figure 32).
- A total of 17,167 additional person years (full-time equivalents) of employment are expected to be realized (Table 7).
- An additional 6,182 person years of direct full-time equivalent employment can be expected (Table 7).
- A differential direct effective wage premium of $3,497 can be expected, whereas the expected total effective wage premium is $1,797.
- All levels of government will derive larger streams of revenues on the economic impacts of electric vehicles over gasoline vehicle manufacturing. The total additional tax revenues at all three levels of government is about $546 million with the federal government collecting an additional $263 million, the provincial government about $212 million and $70 million at the local government level (Tables 7 and 8 and Figures 7 and 10).
- Increases in personal income taxes collection are over $172 million for the federal government and $103 million for the provincial government based on the 5% scenario in 2025. The additional revenues from the Harmonized Sales Tax (HST) include $47 million for the federal government and about $76 million for the provincial government (Table 8).
- Increases in personal income taxes collection are over $195 million for the federal government, $118 million for the provincial government for the 5% 2025 scenario. The additional revenues from the Harmonized Sales Tax (HST) include about $54 million for the federal government and $86 million for the provincial government (Table 8 and Figure 32).
- Major employment changes can be expected due to the substitution of electric for gasoline vehicles. The differences are both in total employment and in the sectorial allocations.
The economic impacts for the 10% scenario in 2025 are simply twice as large as those of the 5% scenario (Table 7 and Figure 31, 32 and 33). For the 5% share of electric vehicles in 2050, the following impacts are expected:
- Total income increases by over $2 billion for the 5% share scenario in 2025. (Table 7, Figure 32).
- A total of 19,466 additional person years (full-time equivalents) of employment are expected to be realized on this substitution (see Table 7).
- An additional 7,009 person years of direct full-time equivalent employment can be expected (Table 7).
- All levels of government will derive larger streams of revenues on the economic impacts of electric vehicles over gasoline vehicle manufacturing. The total additional tax revenues of all three levels of government is about $620 million with the federal government collecting an additional $299 million, the provincial government about $241 million and local governments a total of $80 million (Tables 7 and 8 and Figures 34).
- Increases in personal income taxes collection are over $195 million for the federal government, $118 million for the provincial government in the 5% 2050 scenario. The additional revenues from the Harmonized Sales Tax (HST) include about $54 million for the federal government and $86 million for the provincial government (Table 8 and Figure 34).


Differential Operational Economic Impacts
Two dominant characteristics differentiate EVs from gasoline vehicles: they are cheaper to run and are environmentally cleaner (emit less CO2). Even when a relatively low price of gasoline ($1.23/L) and a high price of electricity ($0.11/kWh) are factored in, EVs can be operated at a fraction of the cost of operating a gasoline vehicle.
The calculations of the differential operating costs of the two types of vehicles are presented in Figure 37. The estimates are based on two sets of assumptions. First, the average annual mileage driven per vehicle is 18,000 km and the total cost of fuel is $1,821 per year (using an average fuel cost per litre of $1.23 in 2011 dollars). This information is gathered by the Canadian Automobile Association based on driving a compact car (Toyota Camry) for 18,000 km in 2011. Second, an EV is assumed to use one kWh charge to travel a distance of 4.67 km (Plug 'n Drive) at a cost of 11 cents per kWh. The 11 cents per kWh was the peak hour cost of electricity in 2011. Operating energy costs of an EV for 18,000 km is then only $426 per year. In 2011, it was possible to charge EV batteries at an off-peak cost of 6 cent/kWh. In its analysis, ERL opted to use the higher price of electricity to show that EVs are significantly cheaper to operate than gasoline vehicles even at peak-hour electricity cost.
Figure 37 shows the differential economic impacts of operating EVs. If the estimated number of EVs in 2012 equaled 5% of total passenger vehicles (258,696 EVs), these EV operations would result in avoided gasoline costs of $471 million, fuel savings of $194 million, and net savings of $167 million. The fuel savings rise to $819 million and net savings to $379 million for the 10% scenario in 2050.

On average, electric vehicles are assumed to cost $7,500 more than a similar gasoline vehicle at current costs (we chose the midpoint range between $4,000 and $11,000). Based on this, it takes less than 5.5 years for the fuel savings to exceed the price differential on the two cars (assuming a 3% discount rate) and less if a higher discount rate is used.
The economic impacts of the operational savings are realized by considering three separate channels:
- The total expenditures on gasoline are treated first as a cost and are entered into the impact model as a negative when they are considered avoided expenditures. This means a total of $471 million for the 5% EV share in the 2025 scenario is subtracted from the expenditures in Ontario. This increases to over $1.1 billion for the 10% EV share scenario in 2050.
- The impact of the additional electricity use of about $110 million (5%, 2025) is added as new expenditures to operate the EV fleet.
- The net savings (the sum of fuel costs savings minus the amortized additional cost of an EV over a gasoline vehicle) are allocated to households as additional disposable income that is assumed spent on typical consumption bundles.
Economic Losses on Lower Gasoline Use
The economic impacts of these different components are estimated separately and combined appropriately under the net savings column in the tables and figures below. The following results emerge first on the losses associated with the elimination of gasoline purchases for the 5%, 2025 scenario:
- Total income losses on eliminating gasoline use are estimated to be in the neighbourhood of $206 million (Table 11 and Figure 38).
- A total of 1,243 person years (full-time equivalents) of employment are expected to be lost on account of the decline in purchases of gasoline in Ontario (see Table 11).
- All levels of government will experience declines in the streams of revenues on the economic impacts of gasoline purchases excluding taxes on gasoline. The total forgone general tax revenues of all three levels of government will be about $57 million with the federal government losing $27 million, the provincial government about $22 million and local governments a total of $7.5 million (Table 12 and Figures 38).
- Decreases in personal income taxes collection will be over $14 million for the federal government and $8.4 million for the provincial government for the 5% 2025 scenario. The additional revenues lost from the Harmonized Sales Tax (HST) include $5.3 million for the federal government and about $8.5 million for the provincial government. These are additional to the fuel excise taxes and other HST taxes on fuels.
- The additional direct taxes that the federal and provincial governments derive on fuel and would be lost are presented in Table 17. These losses include a total of about $105 million (for the 5%, 2025). The federal excise tax on fuels that could be lost are about $52 million, and the provincial excise taxes that could be lost are around $29 million. In addition the federal government will lose $8.3 million in HST and the provincial government will lose $15.5 million.
- Imported products will decrease, particularly those of oil and fuel. In total the decrease in imports will exceed $107.5 million split almost equally between imports from other countries ($55.2 million) and imports from other provinces ($52.4 million) (Table 11 and Figure 39).


The economic impacts for the 10% scenario in 2025 are simply twice as large as those of the 5% scenario.
For the 5% share of electric vehicles in 2050, the following impact losses are expected:
- Total income losses due to decreased gasoline use in Ontario in 2050 are estimated to be over $233 million for the 5% share scenario (Table 14 and Figure 38 and 44).
- A total of 1,411 person years (full-time equivalents) of employment are expected to be lost on account of the decline in purchases of gasoline in 2050 (see Table 14).
- All levels of government will experience declines in the streams of revenues on the economic impacts of gasoline purchases excluding taxes on gasoline. The total forgone general tax revenues of all three levels of government will be about $65 million with the federal government losing about $31 million, the provincial government about $25.6 million and local governments a total of $8.5 million (Table 14 and Figure 44).
- Decreases in personal income taxes collection will be about $16 million for the federal government and $9.6 million for the provincial government for the 5% 2050 scenario. The additional revenues lost from the Harmonized Sales Tax (HST) are $6 million for the federal government and about $9.7 million for the provincial government and are additional losses to the fuel excise taxes and other HST taxes on fuels (Table 16 and Figure 44).
- The additional direct tax losses that the federal and provincial governments would have derived on fuel in 2050 a total loss of over $118.6 million (for the 5% scenario). The federal excise tax on fuels that could be approximately $58.8 million, and the provincial excise taxes of approximately $32.8 million. In addition the federal government will lose $9.5 million in HST and the provincial government will lose $17.6 million (Table 16 and Figure 44).
- Large volumes of imports will decrease particularly those of oil and fuel. In total the decrease in imports will be about $122 million split almost equally between imports from other countries ($62.5 million) and imports from other provinces ($59.4 million) (Table 14 and Figure 44).
The Economic Impacts of Increased Electricity Use
The following economic impact results emerge as economic gains associated with the increased expenditures on electricity purchases in Ontario for the 5% scenario in 2025:
- Total income gains on the increase of electricity use are estimated at approximately $138 million for the 5% share scenario in 2025 (Table 11 and Figures 40).
- A total of 1,003 person years (full-time equivalents) of employment are expected to be gained on account of the new purchases of electricity in Ontario (see Table 11).
- All levels of government will experience increases in the streams of revenues on the economic impacts of electricity purchases. The total increase in general tax revenues of all three levels of government will be about $40 million with the federal government gaining $19.1 million, the provincial government about $15.6 million and local governments a total of $5.2 million (Table 11 and Figures 37 and 39).
- Increases in personal income taxes collection will be over $11.6 million for the federal government and $7 million for the provincial government for the 5% 2025 scenario. The additional revenues gained from the Harmonized Sales Tax (HST) include $3.5 million for the federal government and about $5.7 million for the provincial government (Table 12 and Figure 40).

The economic impacts for the 10% scenario in 2025 are twice as large as those of the 5% scenario (Table 13 and 14, Figures 38 and 39). The economic impact gains associated with the increased expenditures on electricity purchases in Ontario for the 5%, 2050 scenario include the following:
- Total income gains on the increase of electricity use are estimated to be over $156.2 million for the 5% share scenario in 2050. (Table 15 and Figure 44).
- A total of 1,138 person years (full-time equivalents) of employment are expected to be gained on account of the new electricity purchases in Ontario (see Table 15).
- All levels of government will experience increases in the streams of revenues on the economic impacts of electricity purchases. The total increase in general tax revenues of all three levels of government will be about $45.3 million with the federal government gaining $21.7 million, the provincial government about $17.7 million and local governments a total of $5.9 million (Tables 15 and 17, and Figures 43 and 44).
- Increases in personal income taxes collection will be over $13.1 million for the federal government and about $8 million for the provincial government based on the 5% in 2050 scenario. The additional revenues gained from the Harmonized Sales Tax (HST) include $4 million for the federal government and about $6.4 million for the provincial government (Table 17 and Figure 44).
The economic impacts for the 10% scenario in 2050 are twice as large as those of the 5% scenario (Tables 15 and 17, and Figures 43 and 44).
The Economic Impacts of Net Savings on Fuel Use
The following economic impact results emerge on the economic gains associated with the spending the savings on fuels after deducting the amortized higher costs of EVs in Ontario for the 5%, 2025 scenario:
- Total income gains on the spending of net savings are estimated to be approximately $205 million for the 5% share scenario in 2025. (Table 11 and Figure 39).
- A total of 1,878 person years (full-time equivalents) of employment are expected to be gained on account of spending the net savings in Ontario (see Table 11).
- All levels of government will experience increases in the streams of revenues on the economic impacts of spending the net savings. The total increase in general tax revenues at all three levels of government will be about $59 million: the federal government will gain $28.6 million, the provincial government about $23.2 million and local governments a total of $7.7 million (Table 11 and Figure 39).
- Increases in personal income taxes collection will be over $17.7 million for the federal government and $10.7 million for the provincial government for the 5% 2025 scenario. The additional revenues gained from the Harmonized Sales Tax (HST) include $5.1 million for the federal government and over $8.2 million for the provincial government (Table 12 and Figure 40).
The economic impacts for the 10% scenario in 2025 are twice as large as those of the 5% scenario. The impact results of this scenario are presented in Tables 13 and 14, and Figures 41 and 42. The following economic impact results emerge on the economic gains associated the spending of savings on fuels after deducting the amortized higher costs of EVs in Ontario for the 5%, 2050 scenario:
- Total income gains on the spending of net savings are estimated to be approximately $233 million.
- A total of 2,130 person years (full-time equivalents) of employment are expected to be gained on account of spending the net savings in Ontario in 2050.
- All levels of government will experience increases in the streams of revenues on the economic impacts of spending the net savings. The total increase in general tax revenues of all three levels of government will be about $67.4 million with the federal government gaining $32.4 million, the provincial government about $26.3 million and local governments a total of $8.7 million (Tables 12 and 13, and Figures 43 and 44).
- Increases in personal income taxes collection will be over $20.1 million for the federal government and $12.1 million for the provincial government for the 5% 2050 scenario. The additional revenues gained from the Harmonized Sales Tax (HST) include $5.8 million for the federal government and over $9.3 million for the provincial government.
The economic impacts for the 10% scenario in 2050 are again simply twice as large as those of the 5% scenario. The impact results of this scenario are presented in Tables 15, 17, Figures 43 and 44.
The Consolidated Economic Impacts of Operational Expenditures of EVs
The consolidated economic impacts of operating electric vehicles are the sum of the negative gasoline elimination and the positive impacts of spending net savings and increased purchases of electricity. There is no a priori reason that these impacts would be positive but they are. These consolidated impacts are in the column total in each table and they include the following results for the 5% 2025 scenario:
- Despite a total decrease in consolidated expenditures of about $194 million there will be income gains of approximately $137.6 million for the 5% share scenario in 2025.
- A total of additional 1,638 person years (full-time equivalents) of employment are expected to be gained on the consolidated impacts in Ontario.
- All levels of government will experience increases in the streams of revenues on the consolidated impacts exclusive of the losses on direct fuel taxes. The total increase in general tax revenues at all three levels of government will be about $42 million with the federal government gaining $20.4 million, the provincial government about $16.2 million and local governments a total of $5.4 million.
- Increases in personal income taxes collection will be over $15.3 million for the federal government and $9.2 million for the provincial government for the 5%, 2025 scenario. The additional revenues gained from the Harmonized Sales Tax (HST) include $3.3 million for the federal government and over $5.4 million for the provincial government.
- When direct fuel excise and HST taxes gasoline purchases are deducted the net fiscal position of the federal government will be negative by about $14 million ($34.3 million minus $20.4 million) and the provincial government losing a net amount of $52.1 million ($68.3 million minus $16.2 million) for the 5% 2025 scenario.
- Imports will decline by $42.2 million, primarily in the oil industry.
The economic impacts for the 10% scenario in 2025 are again simply twice as large as those of the 5% scenario (Tables 12, 13, Figures 37, 38, 41 and 42). The following economic impact results emerge on the consolidated operational expenditures for the 5% scenario in 2050:
- Total income gains on the consolidated expenditures are estimated at approximately $156 million for the 5% share scenario in 2050 (Table 14).
- A total of 1,855 person years (full-time equivalents) of employment are expected to be gained on account of the consolidated operational expenditures in Ontario in 2050.
- All levels of government will experience increases in the streams of revenues on the economic impacts of spending the net savings. The total increase in general tax revenues at all three levels of government will be about $47.6 million with the federal government gaining $23.1 million, the provincial government about $18.4 million and local governments a total of $6.1 million.
- Increases in personal income taxes collection will be over $17.3 million for the federal government and $10.4 million for the provincial government for the 5% 2050 scenario. Additional revenues gained from the Harmonized Sales Tax (HST) include $3.8 million and $6.1 million for the federal and provincial governments, respectively.
- When direct fuel excise and HST taxes gasoline purchases are deducted the net fiscal position of the federal government will show a loss of about $19.1 million ($42.2 minus $23,1) and the provincial government losing a net amount of $58 million ($76.4 minus $ $18.4) for the 5%, 2050 scenario (Table 17 and Figure 18).
- Imports will decline by $47.9 million, primarily those of oil imports.

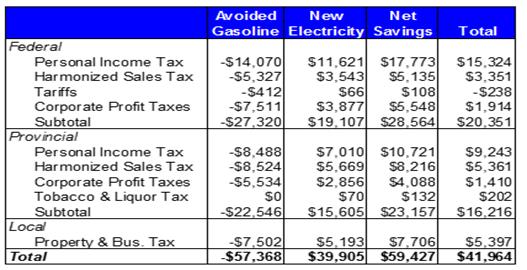

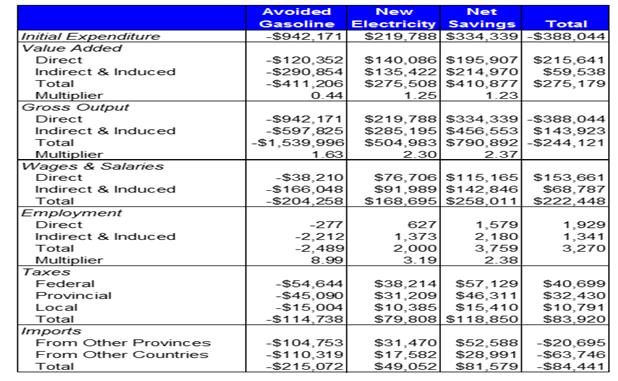

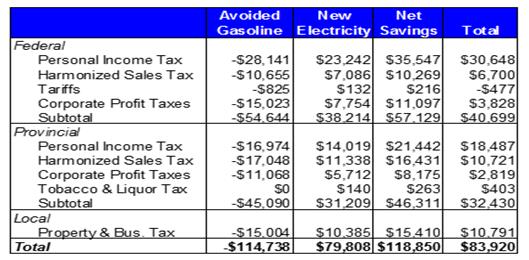

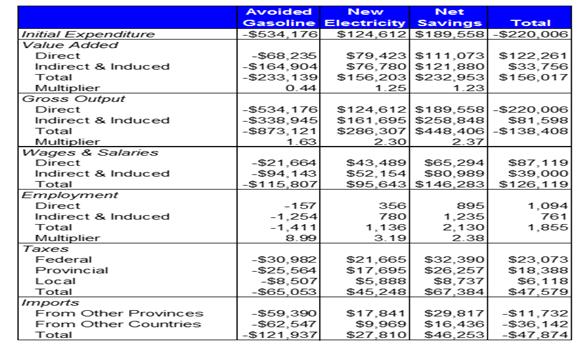
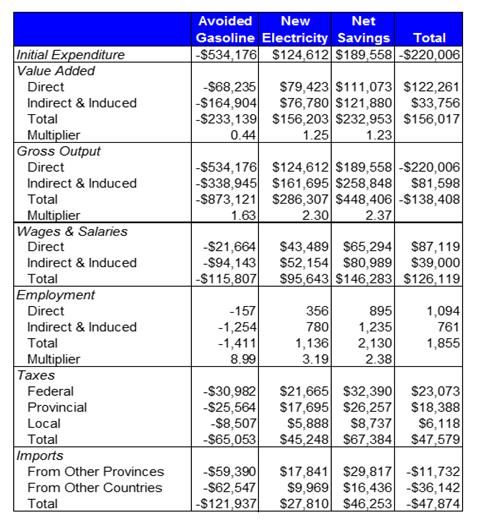

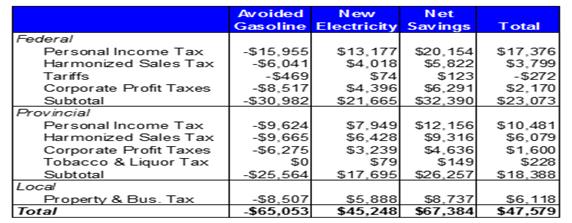
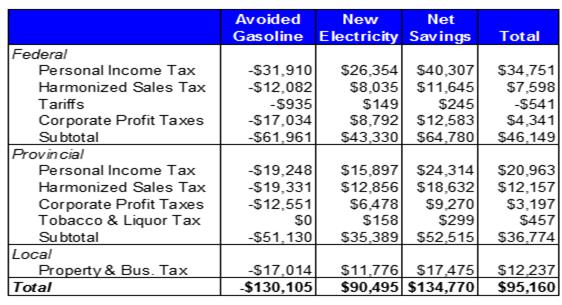

Differential Infrastructural Economic Impacts
Based international standard data collected by the Sustainability Office of the Region of Waterloo, each charging station development costs approximately $10,000 split equally among construction materials, equipment and labour. Each charging service station could serve five vehicles. The total infrastructure development costs using the different scenarios for 2025 and 2050 are reported in Table 18. For the 5% scenario for 2025, the total infrastructure cost in 2011 dollars is $517.4 million and rises to over $586 million for the 5% scenario in 2050. For the 10% scenario in 2025, the infrastructure development expenditures are estimated to exceed $1 billion and these costs rise to $1.2 billion in 2050. These development expenditures drive the impact results and are highly sensitive to the assumptions made about their allocation to the different expenditure components such as labour, equipment or construction. The economic impacts generated by these expenditures cannot be added to the operational expenditures' impacts and manufacturing impacts. The former are lumpy and occur at a given fixed period and last until the development phase is completed. In other words, they are not recurrent, whereas manufacturing and operational expenditures are. Second, they represent gross impacts; no subtractions are made for phasing out or eliminating gasoline stations.

The following economic impacts can be expected on infrastructure investments for the 5% scenario in 2025:
- When direct, indirect and induced impacts are added together, the total income impact of infrastructural expenditures of $517.4 million to service the volume of electric vehicles expected under the 5% scenario in 2025 in Ontario, exceeds $698 million (Table 19 and Figure 45).
- A total of 8,473 person years (full-time equivalents) of employment are associated with investing in charging stations to service electric vehicles under this scenario (Table 19). This employment is supported by a high volume of expenditures on inputs that exceed $16 billion in Ontario.
- More than 4,697 Ontarians owe their direct full-time equivalent employment to these activities (Table 19).
- The effective wages and salaries sustained by these expenditures are relatively high. The direct effective wage is over $60,881 and the total effective wage is higher at $63,491.
- All levels of government derive large streams of revenues on the economic impacts of these expenditures on infrastructure. The total tax revenues at all three levels of government on these impacts will exceed $212 million with the federal government collecting $103 million, the provincial government about $82 million and local governments a total of $27.2 million (tables 18 and 19 and figures 19 and 20).
The economic impacts for the 10% scenario in 2025 are simply twice as large as those of the 5% scenario. For the 5% scenario in 2050, the following impacts are expected:
- The total income impact of development expenditures for the 5% scenario in 2050 in Ontario exceeds $792 million (Table 19 and Figure 45).
- A total of 9,612 person years (full-time equivalents) of employment are sustained in Ontario by these expenditures (Table 19). This employment is sustained by a high volume of development expenditures on inputs of about $586 million in Ontario in 2011 dollars.
- More than 5,326 Ontarians owe their direct full-time equivalent employment to these activities (Table 19).
- The effective wages and salaries sustained by these expenditures are relatively high. The direct effective wage is over $60,881 and the total effective wage is higher at $63,463.
- All levels of government derive large streams of revenues on the economic impacts of charging stations development expenditures. The total tax revenues of all three levels of government exceeded $240.5 million with the federal government collecting about $117 million, the provincial government about $93 million and local governments a total of about $31 million (Tables 19 and 20 and Figures 45 and 46).
Again, the economic impacts for the 10% scenario in 2050 are simply twice as large as those of the 5% scenario as shown in Tables 19 and 20.


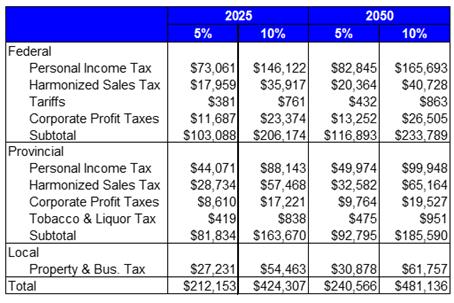

Determinants of Demand of EV Sales
ERL tested economic theory of consumer behaviour by carrying out statistical analysis of economic variables that impact consumer choices. The future demand for EVs is hypothesized to be influenced by the same set of variables that determines the demand for gasoline vehicles. ERL examined the demand relationships and functions for gasoline vehicles and trucks by way of gauging the responses of demand to changes in key variables that are likely to influence the demands for PEVs. Using regression analysis, demand for vehicles and trucks is determined in relation to a small set of variables: real GDP per capita in Ontario, Bank of Canada prime rate, consumer price index for transportation, operation and overall consumer price index.
Vehicles and trucks may be substitutes or even complimentary. In this analysis, demand of light duty gasoline vehicles (LDGVs) is specified as a function of income, interest costs, and the operational costs of a vehicle represented by transportation consumer price index. In the linear regression analysis, real per capita income variables and transportation costs are shown to have significant impact on demand of LDGVs. Log-Linear regression analysis which measures estimates of elasticity shows the results of real per capita income and transportation costs are even more robust than those of linear regression. These results are consistent with economic theory which indicates that higher operating costs discourage vehicle purchases and that higher real per capita income tends to encourage purchases of new vehicles. Furthermore, linear regression analysis with gas prices as an explanatory variable suggests that an increase in per-litre cost discourages demand for LDGVs.
Demand for light duty gasoline trucks is specified in this analysis as a function of real per capita income in Ontario, real interest rate, the demand for light duty gasoline vehicles, and the lagged demand for trucks. The analysis here again is consistent with economic theory and shows that higher per capita income encourages the purchase of light trucks, and both higher operational costs and real interest rate discourage demand for trucks. Out of the three variables, results are most significant for per capita income and real interest rate. Again, when gas prices are introduced in the equation, the results show that the increases in gas prices reduce the demand for light duty trucks. The analysis also suggests trucks and passenger vehicles are more so complimentary goods than substitutes. Log-linear regression analysis of trucks with its variables produces high income elasticity results which mean that increases in income increases demand for trucks more than proportionally.
The analysis discussed in this section suggests that higher vehicle or truck operating costs and higher gasoline prices discourage the demand for both light duty trucks and vehicles, and both of these determinants can drive demand for EVs in Ontario. More people are expected to gravitate towards purchasing EVs as operating costs and gasoline prices increase. Furthermore, our analysis also suggests that higher income leads to increase in demand for vehicles. This suggests that Ontario has to encourage economic development and prosperity.
Economic Impacts of Surplus Baseload Generation
Ontario's electricity market is unique. The wholesale price is based on matching Ontario's supply with demand. Every five minutes, the Independent Electricity System Operator (IESO) forecasts electricity demand throughout the Province and directs generators to provide the required amount of electricity to meet that demand. Power generators, such as nuclear and gas power plants, bid to provide the electricity based on the demand forecast. IESO accepts the lowest bids from generators until Ontario's demand is met. The accepted price is the wholesale price for electricity. However, in addition to the wholesale price, consumers also pay a debt retirement charge as well as a Global Adjustment Charge (GA). The GA is imposed on all electricity consumers as a way to generate revenue to subsidize the refurbishment of electricity generation plants and fund demand management programs.[67] However, the majority of the GA has gone towards the refurbishment of nuclear generators and less than 10% of the funding was used to support energy efficiency programs.[68]
Some sources like nuclear power generation are not flexible in meeting the constant change in electricity demand. In other words, it is difficult to adjust the amount of power a nuclear reactor is generating, it is either all the way on or it is off. It is these sources of energy that provide Ontario's base load capacity, with additional sources that come online when our electricity demand increases during peak times. This inability to adjust nuclear power generation and production of additional energy presents some challenges. First, some types of electricity generation cost more than others, with nuclear generation being one of the more expensive. As discussed earlier, more than half of Ontario's power comes from nuclear generation. Secondly, on the supply side, Ontario's electricity generation capacity has grown, partly from the new renewable sources coming online. These two issues together create a Surplus Baseload Generation (SBG) situation. This means that Ontario's electricity production from baseload facilities like nuclear power plants creates more energy than the demand for energy. This occurs particularly at night time, resulting in cheaper electricity in Ontario during this time with off-peak pricing.
This dilemma creates opportunities for EVs to play a role in alleviating Ontario's SBG situation by charging during the night. The SBG that is generated needs to go somewhere. Currently, during off peak hours, Ontario exports the excess energy to neighbouring jurisdictions. However, during surpluses the price for electricity drops and sometimes falls below market value or into negative pricing. In other words, Ontario pays other areas to take our electricity. The reason is that it is too expensive to turn off and then turn back on a nuclear reactor, creating a significant economic loss for the province. For example, from September 2010 to September 2011, Ontario sold about 278 GWh of energy at negative prices to neighbours and paid about $15 million dollars to do so.
[69] This cost only considers a portion of the renewable energy that is coming online. IESO has predicted that for 2014 the frequency of nuclear shut downs will increase dramatically costing an additional $180 million in extra natural gas fuel costs to consumers.[70] This is a problem that needs to be addressed considering the plans to increase nuclear power generation as outlined in Ontario's Long Term Energy Plan and if Ontario wants to continue to develop renewable energy sources.
Poor economic conditions like the 2009 recession exacerbate Ontario's SBG dilemma by decreasing the demand for energy. The solution is either to sell that energy at a more cost effective price or to ensure that Ontario is able to utilize the SBG locally. Using it locally could mean having a load that would use the energy during the off-peak hours or to store the energy. Unfortunately, Ontario does not have a large scale energy storage solution: however, EVs could be part of the solution. Not only does the SBG situation encourage nighttime charging, but with the future of smart grids, EVs could act as an energy storage solution.
Summary
The development of Plug-in Electric Vehicles (PEV) sustains many economic, environmental and technological gains in the production of electric vehicles, their operation and construction of supporting infrastructure. Electric vehicles are shown to realize large energy savings and many industrial gains, but may also cause some disruptions and substitutions in the economy. The net effects, however, are almost all positive. In particular the ERL's economic analysis demonstrates the following:
- Large energy savings, particularly in those expensive and non-renewable fossil fuels imported from outside Ontario.
- Reductions in CO2 emissions and the prospect of placing Ontario as a frontrunner in the fight to eliminate CO2 emissions.
- Developing a new and dynamically growing industry with a capacity to generate sizeable employment opportunities at the upper end of the wage scale.
- Developing a new infrastructure of charging stations.
- Limited additional electricity generation capacity and delivery systems are needed when the projected shares of EVs are less than 10% of the Ontario fleet of vehicles.
- The phasing out of an old industry and the development of a new industry requires more but manageable numbers of graduates from universities.
- The estimation of net benefits with a special focus on disruptions, substitutions and changes in the product and factor markets in Ontario all show positive returns and feasible proportions.
Major gains are expected in the manufacturing sector but substantial gains can be realized in the energy and infrastructure development sectors, as well. Ontario manufacturing has sustained major losses recently as the Canadian dollar appreciated and provincial productivity declined. Imports of expensive energy, particularly gasoline, exacted a heavy cost on the economy in step with escalating oil prices. The development and use of electric vehicles holds the promise to save Ontarians considerable amounts of money as cheaper electricity is substituted for the expensive imported gasoline and as a new manufacturing node is developed to shore up the sagging auto sector.
As described in this section, there are tremendous economic opportunities associated with the EV industry. Many jurisdictions in North America are competing to establish EV manufacturing hubs. It is imperative that Ontario proactively engages to make Ontario an important hub of EV manufacturing not just for Canada but for all of North America. Failure to do so would result not just in missed economic opportunities but also in economic losses. If Ontario is unable to exploit the growing EV market by establishing its own EV industry soon, it would then be playing catch up to other jurisdictions and it will never be able to recover from these missed economic opportunities.
D. Educational and Employment Requirements
Introduction
Ontario's transition to a green economy will not only present vast economic opportunities but also labour and human resource challenges. The EV industry sits at the cross roads of both clean energy and innovative automotive technology. The clean technology and automotive sectors have both been identified as key industry sectors crucial to Ontario's economic future. The general consensus is that Ontario's transition to a green economy will create new jobs, require the adoption and reallocation of existing skills, and require workers to acquire specialized skills, knowledge, training or experience.[71] It is important to understand the needs of both employers and the employees in the new and growing EV industry, an important subset of the overall green economy. In the new knowledge and green economy, Ontario's current and anticipated opportunities exist in areas of research and development, technology innovation and software development. According to the Workforce Coalition, the technological revolution is creating new occupations and transforming existing jobs almost daily.[72] The occupations must consist of high-skilled and high-paying jobs in Ontario as half the jobs in the Province over the next 15 years will require the ability to use technology that has not yet been invented.[73] This is extremely relevant to EVs as new software, battery technologies and electrical components evolve to make EV's more efficient.
Projected Employment Growth Rates
The economic impact analysis conducted by Econometric Research Limited (ERL) estimates that manufacturing electric vehicles in Ontario would create thousands of full time jobs. The number of new jobs is based on the number of electric vehicles that would be manufactured and operated in Ontario. According to our estimates, the higher the uptake in EV adoption, the larger the economic impact across Ontario. Although the total number of employment opportunities is important, it is less so than the allocation of these new jobs across the various industry sectors. Some sectors will gain employment and some will lose full time employment as Ontario starts to manufacture EVs. Understanding the allocation across various industry sectors would help policy makers and universities/colleges in Ontario understand the educational requirements necessary to successfully prepare the workforce for future jobs and facilitate worker transition for those most likely to suffer job loss.
ERL analyzed 4 different scenarios. It estimated job growth in a scenario where 5% of all light duty passenger vehicles are EVs in 2025 and 2050. It also estimated job growth for scenarios where EVs are 10% of passenger vehicles in Ontario in 2025 and 2050. In the 5% EVs in 2025 scenario (258,696 vehicles), ERL estimated that the EV manufacturing industry[74] will create 17,167 full time equivalent positions, including 6,182 direct employment positions and 10,985 indirect full-time employment positions. In the 10% EV 2025 scenario (517,392 vehicles), Ontario's EV industry is estimated to create 34,334 full time jobs: 12,363 direct jobs and 21,971 indirect and induced jobs. The 5% EV scenario in 2050 (293,342 vehicles) would create 19,466 full time jobs and the number of full time jobs would be 38,933 in 10% EV scenario (586,683 vehicles).

Different skill sets, occupations and sectors would come on stream to deliver and sustain the new industry and products. ERL analysis highlights that the manufacturing of EVs would require fewer metals and fabricated metal products and far more electrical products and equipment. Because operating EVs requires higher electricity consumption, power utilities will have to upgrade electricity distribution, less oil will be imported, less oil refining will be needed and less gasoline will be produced or imported and less will be delivered or pumped in Ontario for transportation. A new infrastructure of charging stations will also be required and these can either potentially replace gasoline stations or co-exist with them. The economic analysis suggests these drastic changes will not take place without impact on the labour market or the educational attainment of the labour force in Ontario.
Categories of New Jobs in Demand
Jobs Created by EV Manufacturing:
As Ontario transitions towards manufacturing EVs, it is likely to experience most of the job growth in the computer and electronic technology sector and electrical products. Based on our economic analysis; minor decreases in employment are expected in metal fabricating and primary metals sectors, and small employment decreases can be expected in the motor vehicle parts sector. Figure 2 shows the seven with the most significant changes. The figure shows that most significant employment gains would be experienced in computer and electrical technology, and electrical products, followed by trade services and business and professional services.

Jobs Created by EV Operations
WEC's economic impact analysis determined both the effects of a decline in gasoline use and an increased use of electricity as the result of higher levels of uptake in EV adoption. Table 21 shows the total employment gains in all four baseline scenarios as a result of EV operations, resulting in positive gains in full-time employment in Ontario. Figure 49 shows the impact of operations on job losses and job creation for the EV industry. The figure shows the employment gains and losses in the 5% scenario for 2025 and 2050, respectively. The employment impact takes into account the employment gains and losses as a result of less gasoline consumption, increased usage of electricity, and the net savings (the sum of fuel costs savings minus the amortized additional cost of an EV over a gasoline vehicle of $750 per year per vehicle) which households spend on consumer goods and services. These savings that result from less gasoline consumption becomes additional disposable income for households, a portion of which is used for additional household consumption. The decline in gasoline consumption would result in employment losses in the following sectors: mining, petroleum products, trade, and business and professional services. Most of these job losses would be compensated by jobs gained as a result of increased electricity use throughout the province, both as a result of manufacturing and operation of Electric Vehicles. Through the operation of EVs, most of the employment gains would be expected in the utilities sectors, business and professional services and trade services. Overall, the consolidated economic impacts of operating EVs, net of losses in petroleum consumption and increases in electricity consumption are expected to generate positive gains in employment in trade services, utilities, accommodation and meals, and business and professional services. The effect under the 10% scenario in 2025 is twice as much as the 5% scenario for the same time period.


Jobs Created by EV Infrastructure Development
Infrastructure development in Ontario, including investment in charging stations, is expected to create employment opportunities in construction, electrical equipment, trade services, business and professional services, accommodation and meals services sectors. Construction and electrical equipment would generate the most jobs as a result of EV infrastructure development. Ontario has already made significant advancements in smart grid capabilities and has an established smart grid employment base. EVs will play a role in smart homes, energy storage and smart energy networks. The smart grid principles have been further instituted in the OEB Renewed Regulatory Framework (see below) and over the course of the coming years, will guide the regulator's assessment of the capital investment plans of all regulated utilities in the province. In 2011 the combined net capital investment portfolio of Ontario's distribution sector was $1.9 billon.[75] The Ontario Smart Grid Forum conducted a review of the impact of job creation as a result from smart grid investments. They identified a prominent study of this potential in a U.S. Department of Energy follow-up study on the impact of the American Recovery and Reinvestment Act (ARRA) of 2009. Specifically, the study examined the economic and job creation impact of the $2.96 billion of smart grid-related investment pumped into the U.S. economy via both utilities and private sector companies under the auspices of the ARRA stimulus funding. The study examined both the direct impact on what the report classified as smart grid vendors
as well as the indirect effects on the broader economy. The study found that:
- The original $2.96 billion ARRA smart grid investment triggered over $6.8 billion in overall economic output as of the end of 2012.
- The job creation impact included 33,000 direct, indirect and induced jobs with
smart grid vendors
and another 14,000 jobs in the broader economic sectors that fed into the smart grid vendor community, for a total of 47, 000 direct and indirect jobs.[76]
In Ontario, an anecdotal example of the job creation effect of Smart Grids comes from a 2012 annual survey of 39 energy sector companies conducted by the MaRS Discovery District. That sample study found that over 660 jobs, of which 157 were new hires were reported at the end of 2012 by MaRS energy sector venture clients, $55 million total revenues generated, $46 million total international revenues generated and $56 million total funds raised.[77] While these studies don't encompass the entire smart grid sector in the province, it does provide an indication of the economic potential of smart grid.

Most occupations in the EV industry would be specialized and would require specific skill sets, experience or a combination of both. These occupations would include scientists who conduct research in electric drive technology, manufacturing workers who build EVs, and automotive technicians who repair EVs.[78] As the development of EV industry gains momentum, most EV occupations can be expected to grow. EV occupations can be broken down into the following categories: scientific research, design and development, manufacturing, maintenance, infrastructure development, and sales and support[79].
Scientific Research
In scientific research, the EV industry would require chemists and material scientists to conduct research on improving battery technology, battery life and recharging time[80]. Chemists study properties, composition and structure of matter and use this knowledge to conduct research to enhance battery efficiency and technology. Material Scientists study the structures and chemical properties of various materials to enhance and develop products. They are heavily involved in conducting research to improve various aspects of battery technology. Both these occupations would require a doctoral degree in order for both chemists and material scientists to conduct original research, improve technology and develop products. Some of these scientists may be able to find work in the EV industry with a Bachelor's or Master's degree. Regardless of their academic qualifications, they would need computer skills to perform data analysis, integration, modelling and testing.
McMaster University and their Automotive Resource Centre is one such example and one of a few Centre's in the world located in an academic setting, and will allow both private and public sectors to work together to develop, design, and test hybrid technology. It includes a focus on software, materials, engineering as well as a Bachelor of Technology Program where McMaster University's Faculty of Engineering and Mohawk College's School of Engineering Technology have partnered in response to the needs of today's innovation-based organizations. The University of Ontario Institute for Technology (UOIT), located in Oshawa, is another example of a post-secondary institution that is involved in the research and development of electric vehicle and smart grid technologies. UOIT delivers a leading-edge learning environment that uniquely combines academic knowledge, research opportunities and hands-on skills to its many undergraduate and graduate programs. UOIT is home to the Automotive Centre of Excellence, a testing, training and research centre which is available to anyone seeking to test their ideas. UOIT is also a participant in AUTO21 — Canada's national automotive research program — and vehicle-to-grid communications testing. AUTO21 brings together nearly 200 top Canadian researchers at 46 universities and partners them with 120 industry and government partners. An annual research budget of approximately $11 million in federal and industry support fund projects within six key research themes; including materials, manufacturing and powertrains, fuels and emissions. Other notable centres for scientific research include the University of Windsor's Centre for Hybrid Automotive Research and Clean Energy/ and the University of Waterloo's Centre for Automotive Research, both conducting research on powertrain technologies, vehicle software, vehicle to grid technologies and automotive materials.
Design and Development
Design and development occupations include engineers, engineering technicians, drafters, software developers and industrial designers[81]. Engineers are highly sought after in the automotive manufacturing industry and are expected to be in high demand as the EV industry grows in Ontario. Engineers resolve technical issues, bridge the gap between scientific research and commercial applications; design, test, integrate and evaluate product components. The various categories of engineers required to initially support an emerging EV industry and then later to maintain it are chemical, electronics, industrial, materials, and mechanical engineers. However, it is industry consensus that mechanical engineers would be less sought after than the other aforementioned categories. Mechanical drafters and engineering technicians would also be needed to assist engineers in the product design and development phase because they prepare detailed drawings that illustrate the assembly of machinery and mechanical devices. Computer software developers and other occupations in software development and research would also be in high demand because modern vehicles, especially EVs, are computer controlled and EVs also use on board computers for proper production and distribution of electricity. ERL analysis estimates that if 5% of all passenger cars in Ontario are EVs in 2025, computer and electronics sector would experience growth in total jobs of about 2,500 and the electrical equipment category would experience job growth of about 6,000. Although it is difficult to determine how many of these jobs are for engineers and what kind of engineers, or electricians, it is safe to assume that a sizeable portion of new manufacturing jobs would require at least a good share of electrical, electronics and computer engineers, especially in design, research and development phase. Currently, most of the design and development is carried out in the U.S. and in the presence of a strong and growing EV industry in Ontario, at least some of this design and development work could shift to the province. This could create jobs for all participants in the design, development and research process, and these would include mostly scientists and engineers.
To date, billions of dollars have been invested into Ontario research facilities, universities, and employers for the design and development of electric vehicles and their components. Most notably is Magna International Inc., which received close to $50 million in 2011 for the research and development of hybrid and electric vehicle technologies, components, and engineering services to the automotive industry. The company themselves also invested over $400 million into the research and development of electric vehicle technology in Ontario. Combined, these investments created over 700 jobs and protected another 1300 across Magna's four plants in the province.
Another interesting design and development initiative is the Ontario BioCar Initiative, a partnership between the automotive industry and the public sector, aimed at accelerating the use of biomass in automotive materials. The research team consists of the University of Guelph, University of Toronto, University of Waterloo and the University of Windsor. Through this public and private sector research, they hope to establish a globally leading initiative to bring products from the field and forest to the highway. With the focus on the replacement of petroleum-based products by bio-chemicals and high content bio-fibre materials, the outcomes of research could have a significant positive effect on the profitability of Ontario farming, Ontario forestry, and create a sustainable, competitive edge for the Ontario automotive value chain.
Manufacturing
EV manufacturing would require its workers to utilize specialized training because the process is more complex than the ICE manufacturing process[82]. Electric vehicles require products such as electric motors, computers, electronic control devices, sensing equipment, and more plastic components than a traditional ICE. The process of putting together all these components is different than that of typical ICE manufacturing process. Jobs in the electric vehicle industry include various assemblers (electrical and electronic equipment electromechanical equipment, engine and other machines, and team assemblers), machine tool operators, machinists, and industrial production managers[83]. Most of these would require college diplomas, apprenticeships, and on the job training, and industrial production managers would require at least a Bachelor's degree.
The manufacturing jobs only include the manufacturing of the vehicles and their components throughout the supply chain. There is more opportunity for jobs in the manufacturing of charging station, smart grid and vehicle to grid equipment.
Maintenance
Occupations in electric vehicle maintenance would require repair technicians to get specialized training in electric drive technology.[84] Most technicians currently servicing vehicles would have to be retrained and there would be opportunities for new technicians to enter the field. These occupations would require formal training through a diploma or apprenticeship program or both, as well as on the job training. Compared to current internal combustion engine vehicles, EVs don't need as much maintenance, especially because there is no transmission. However, EV batteries need to be regularly checked and requires regular software updates. Both of these maintenance jobs are specialized skills. Currently, EV owners have to go to specific maintenance or service locations, which can be inconvenient. EV owners have limited choice where they take their cars because only a few skilled workers or maintenance shops in Ontario have the training to service EVs. With an increase in EV uptake, more people would have to be trained in servicing EVs. Furthermore, collision recovery, towing and first aid response for an EV is different from an ICE because of the presence of electricity and other electronic equipment. One such example is the training of first responders, some of which is through the National Fire Protection Association and the National Electrical Trade Council.
Infrastructure Development
Infrastructure development jobs include urban and regional planners, electrical power line installers and repair-people, and electricians.[85] Urban and regional planner positions usually require a Bachelor's degree in urban planning and design, at minimum. Installers, maintenance workers and electricians can learn through a combination of diploma or apprentice programs or on the job training. The EV industry will also create opportunities for retail sales and sales support staff. EVs provide great revenue opportunities for utility companies. In the last few years, Ontario utility companies have had lower revenues because of Ontario's conservation policies and less-than robust manufacturing sector, however, uptake in EV adoption would provide utility companies with a new source of electricity sales. This additional revenue would not be without its challenges in utility asset management; health and maintenance of transformers, and other transmission and distribution channels would have to be constantly reassessed and upgraded to accommodate higher EV uptake. Since the utility sector is a major job creator, its employees would need to be more tech savvy, require better communication skills and GIS training in order for utility companies to be smart meter driven.
Participants in the WEC's research have identified that a new subsector called Smart Charging
could be created within the EV industry. Utility companies are already using smart meters, however they are a work in progress. Various smart meter technologies and smart charging business models are expected to materialize as the EV industry in Ontario continues its growth. Additionally, battery recycling and repurposing industry, EV charging station installation, maintenance and inspection services are also expected to join the ranks of existing industry sectors.
Educational Requirements
WEC's commissioned economic study conducted by ERL estimates that a shift from gasoline light vehicles to EVs would involve the creation of a large number of full time employment opportunities as described in the above sections, and these new full time jobs are heavily concentrated in the upper educational ranks of the work force.
Using the same scenarios in earlier sections to project the numbers of EVs that could be expected under different assumptions, the following labour market impact results shown in Table 2 emerged:

The EV manufacturing industry, in the highest share of net jobs created in all four scenarios, would require an education level of a Master's degree or PhD. The second highest net gain is in jobs that require a Bachelor's degree and the lowest net increase in jobs is for workers with 0 to 8 years of education. In terms of job losses as a result of less gasoline consumption, most jobs are expected to be lost in education category of postsecondary certificate and diploma holders, followed by high school graduates.
Table 22 shows total and net educational requirements as a result of EV operations. There will be full-time employment (FTE) job losses in sustaining the operational impacts arising from the substitution of EVs for gasoline vehicles. For the 2025, 5% scenario the total decline in labour requirements is in the order of 239 FTE jobs and most of the decline is likely to be concentrated in the lower educational ranks; high school graduates will lose the most jobs, followed by those with certificates or diplomas. There will be net addition full-time employment openings for workers with above bachelor university degrees. These trends are similar across all scenarios.

Table 23 and Figure 51 show the net educational requirements of both manufacturing and operations. Table 23 shows that most of the employment gains are for workers with at least a post-secondary certificate or diploma, with the highest share going to holders of degrees above a Bachelor's level, followed by holders of a just a Bachelor's degree.


Overall, Development of the EV industry in Ontario would necessitate higher education. ERL estimates the majority of the full time jobs in the EV industry would require a university degree above the bachelor level, and these would be followed by full time jobs that would require an equal number of college certificate and diploma holders, and university bachelor degree holders. A relatively low addition in employment is expected for those with only high school diplomas and much lesser jobs for those with some high school or less than eight years of schooling. Operational impacts of EV would result in job losses which would mostly be experienced by lower educational ranks, particularly those with a high school diploma, closely followed by certificate or diploma holders. However, there will be net additions in jobs for workers with higher education level than Bachelor's. Therefore, the highest share of the jobs created by both the operation and manufacturing of EVs would require at least a university level bachelor's degree.
It is important to analyze and interpret the ongoing/current changes in Ontario's education sector, both in terms of total degrees awarded and subject areas in which these degrees are awarded to better understand its current state. Figure 52 shows the total number of degrees awarded in Ontario from 2001 to 2012 and shows that all degree levels, (Bachelor's, Master's, and PhDs) are on the rise, and this is an encouraging trend. For example, in 2001, the total degrees awarded in Ontario, including Bachelor's, Master's, PhDs, diplomas and certificates equaled 67,690. In 2012 the total degrees awarded were about 109,000. Out of the four categories, degrees awarded in masters and PhDs grew by more than 90% from 2001 to 2011 with annual rates of 6% for both categories, whereas degrees awarded in Bachelor's and diplomas/certificates grew by 55% and 43% with annual rates of 4% and 3%.

Figure 52 is an extension of Figure 51 and it not only shows total degrees awarded per category (Bachelor, Master, PhD) in Ontario but also degrees awarded in each category per 1,000 people. In 2001, the total graduates per capita were 5.69 and 8.06 in 2012. Bachelor degrees per capita in Ontario were 4.61 in 2001 and 6.31 in 2012. In terms of types of degrees awarded, figure 7 also shows that degrees awarded per capita in diplomas/certificates and PhDs experienced smaller changes compared to degrees awarded in Bachelors and Masters per capita. In 2001, diplomas/certificates awarded per capita is 0.14 versus 0.18 in 2012, similarly PhDs awarded per capita in 2001 is 0.12 and 0.20 in 2012. Bachelor degrees awarded per capita in 2001 is 4.61 in 2001 and 6.31 in 2012, and Masters degrees awarded per capita is 0.81 in 2001 and 1.37 in 2012. Therefore, overall the per capita growth in Masters and Bachelor degrees awarded are higher than diplomas/certificates and PhDs per capita in Ontario. Figure 53 shows total college and university graduates and per capita college and university graduates for Ontario. It shows six categories: total university degree graduates, college graduates who graduated with diplomas, certificates, degrees, university graduates with diplomas, certificates and degree and per capita rates of the aforementioned categories. Figure 53 shows that total graduates including all types of credentials from both colleges and universities and their relevant per capita rates have been on the rise since 2001.

As shown in Figures 51 and 52, the number of graduates and the per capita levels are increasing and shows an encouraging trend in educational attainment in Ontario. However, analyzing the number of graduates by subject area reveals further insight which may be more helpful for policy makers.
Figure 53 shows that the share of graduates in mathematics, computer and information sciences have been consistently decreasing. The EV industry would require highly-skilled employees in computer sciences and other relevant technological fields, and decreasing enrollment and the overall number of graduates in computer sciences, mathematics and information sciences is not conducive to Ontario's EV industry. Figure 9 also shows that although overall share of graduates in architecture, engineering and related technologies has increased from 2003 to 2012, its share has decreased. In 2003, the share of graduates in architectural, engineering and related technologies was 9.31 and in 2012, it was 8.36. It is important to understand the underlying reasons for these trends and innovate policies to address these discouraging trends. Computer and information sciences, engineering and technologies are vital for the EV industry and it's important to encourage and sustain good graduation rates in these categories to endure a successful EV industry in Ontario.

Figure 54 also shows decreasing trends in degrees awarded in mathematics and physical sciences in Ontario. In a 2013 report The Conference Board of Canada highlighted the current shortage and anticipated shortage in computers and information technology workers, and how such labour and skill shortages could prove to be detrimental for the EV industry especially during its preliminary growth stages. The share of graduates in the physical and life sciences category has been either steady or decreasing on average (Figure 9) and the number of degrees per capita awarded in mathematics/physical sciences has followed the same downward trend (Figure 10). Physical sciences such as chemistry and materials sciences are considered very important for achieving progress in battery technology. Relevant policies to encourage enrollment and completion of programs in physical sciences, computer sciences and information technology are very important in the development and competitiveness of Ontario's EV industry.

The economic analysis conducted by ERL estimates that computer, electronic, and electrical equipment categories are the most important when it comes to job creation in the EV industry. According to the analysis, more than 50% of employees in these two categories would require higher than a Bachelor's degree (Table 25). Anticipating the requisite educational and skill requirement sooner rather than later would ensure that Ontario can capitalize on the economic opportunity led by growth in the EV industry. It is important to encourage students to pursue programs in computer, electrical engineering and electronics and to ensure that engineering and science graduates in Ontario have ample career opportunities available to them in the province so that they are not enticed by out of province offers.

Training and Skill Gaps
According to the Conference Board of Canada, Ontario already suffers from a skills gap in its current work force, costing the economy about $24.3 billion in forgone GDP, $4.4 billion in federal tax revenues and $3.7 billion in provincial tax revenues. The labour markets also suffer from skill mismatches, and for employees pertains to employment in occupations which fail to utilize the full extent of education and skills, particularly in areas in with little labour market demand. This costs the Province up to $4.1 billion in forgone GDP and $627 million in provincial tax revenues annually[86].
Ontario's economy suffers from skill gaps in sectors which make up 40% of employment in Ontario. These sectors include manufacturing, health care, professional, scientific, and technical services, and financial industries. This skills gap is expected to worsen as shortages in high skill work categories increase and unemployment in low skill employment decreases. This is particularly relevant for the EV industry as most jobs created in the industry would fall under the high skill category. The board also states that employers are in the greatest need of post-secondary credentials in the subject areas of science, engineering, technology, finance and business professions. In terms of the types of credentials required, the greatest needs are for employees with two or three-year college diplomas (57 per cent); four-year degrees (44 per cent); and trades (41 per cent). It is interesting to note that Ontario's skill shortages and demand for post-secondary credentials in sciences, technology and engineering coincide with anticipated demand for education and skills in the same subject areas as in the EV industry. Mismatches between the skills and education required by employers and those that employees or graduates have are growing due to technological changes, demographic changes, and persistent misalignment between the labour market and parts of the post-secondary education system[87]. The majority of the employers surveyed for the conference board's report mentioned the skill requirements in their businesses had increased over the past decade and that these skill requirements are expected to increase further over the coming decade. The emergence of knowledge economy would require that Ontario educate more of its workforce beyond high school levels. By 2031, Ontario would require that 77% of its workforce have post-secondary credentials (apprenticeship, university, college, industry professional)[88]. Overall, in 2010, Ontario stood at 60% in terms of post-secondary credential holders, with its younger population (25 to 34 years of age) at just over 66%.[89] Even though 57% of Ontarians hold a university or a college credential the quantity and quality of graduates and employees still lag Ontario's employer's needs.
Environmental Careers Organization (ECO) Canada in its research identified a need for specialized skills in the area of battery technology and power electronics.[90] Technological change in the workplace means that many people's skills could become obsolete in just a decade.[91] Employers are now seeking employees with high levels of education and new sets of skills and knowledge areas. In addition to the technical skills and knowledge, employees will also be required to possess soft skills, be able to adapt to new technologies and to interdisciplinary thinking that develops relationships across industries and organizations to support system integration.[92] This is evident in Ontario, where a growing trend, especially in new and evolving high-tech
jobs, is the demand for workers with a combination of technical training, formal education and soft
skills.[93] It is important to ensure that this skill mismatch is minimized especially as Ontario proceeds with developing and nurturing its nascent EV industry. Failure to do so will have negative consequences for Ontario's economy, businesses, and individuals.
The Conference Board has highlighted labour or skill shortages in both construction and utilities sector, and both these sectors are potential sources of job creations as the EV industry in Ontario picks up. In the construction industry the occupation shortages would include civil engineers, civil engineering technologists, and architectural engineers. In the utilities industry, Ontario employers expect shortages in electrical and electronic engineers. Overall, Ontario employers expect the most labour and skill shortages in engineering professions, electrical trades and related professions, information and network technology professions, skilled labour and trades, sales and business management professions. Employers have also mentioned shortages in natural and applied science and related categories including engineers, architects, urban planners and land surveyors. At least some if not all of these occupations are expected to grow in demand with the increase in activities in the EV industry. Figure 56 shows that trade registration has been steadily growing in Ontario and Figure 57 shows interval growth of various categories of skill trades. Although personal acquiring trade qualifications and trainings are on the rise, Ontario still faces labour shortages in trades and these shortages could hamper EV industry's growth in Ontario.


Labour Shortages
It is not just the automotive and manufacturing sectors that will face shortages in the workforce. Electricity Human Resources Canada (EHRC) recently conducted a report on how Canada will meet its human resources need in the renewable electricity industry. With the potential for large EV adoption rates in the Province, there will have to be upgrades to the existing infrastructure as well as the creation of new generation from renewable energy sources.[94] For example, according to Ontario's Long Term Energy Plan, nuclear power generation is going to be a big part of Ontario's energy future. The Canadian Manufacturers and Exporters reports that 15,600 people are employed in the operation and support of nuclear plants in Ontario, and 9,000 more would be employed for the refurbishment of the Ontario plants, for a total employment of approximately 25,000 people during the refurbishment period.[95]
The skills and occupations identified as being critically important to this area were electricians and electrical engineering technicians, and technologists. Along with the growing and changing skill demand, Ontario's experienced workforce is retiring and many of the youth who are now entering the workforce do not have the education or qualifications to fill these positions. There are also many highly-skilled, internationally-trained individuals entering Ontario, however many of them are having a hard time finding full time employment in their field because their qualifications do not meet Ontario's certification standards or they are entering Ontario education institutions.[96] Without the proper training and education, individuals will find themselves without jobs and businesses will find themselves without skilled and knowledgeable employees.[97] A recent Conference Board of Canada study of labour supply and demand projected that Ontario could face a shortage of 564,000 workers by 2030.[98]
Training
In Ontario, there are very limited opportunities for training in the EV sector. The National Electrical Trade Council (NETCO) developed the Electric Vehicle Infrastructure Training Program (EVIPT). It was established to provide the EV transportation sector of the electrical industry and all stakeholders, with a structured platform to facilitate training and certification for the installation of Electric Vehicle Supply Equipment (EVSE) across residential, commercial/public and fleet markets.[99] In addition to NETCO, CARSOnDemand offers training in areas of electrical engines and hybrid technologies. For employees who work at a business that is not a dealer, they are left to find their own job training. Even for those employees who work at companies which sell EV's and has access to training through dealerships, the training still needs refreshing to reflect the arrival of EV's to the market place.[100] More generally, employers are spending less on employee training overall. Learning and development expenditures have decreased 40% since 1993, with most of that occurring between 2004 and 2010.[101] If employers want to avoid many of the negative impacts associated with skills shortages, this is an area where their own performance must improve.[102]
There are also 2 Automotive Training Centre's in Ontario which offer accredited courses as an approved vocational program. They offer courses and programs ranging from automotive sales to automotive service technician. However, upon a preliminary review of their program offerings and curriculum, there are no specific training sections which focus on electric vehicles. It will be critical for these types of training centres and other institutions which offer certifications in the industry to adapt their programs to included electric vehicle technologies.
Collaborative efforts between all relevant stakeholders are essential to facilitate, expedite and nurture growth in the EV industry. Public institutions, training institutions (colleges, universities and various training centers), and private sector entities (automobile and part manufacturers, researchers and technology developers) will all have to co-ordinate efforts and work with an all-inclusive strategy to minimize skill gaps and mismatches. In a growing industry such as EV industry, educational gaps, skill mismatches will likely end up costing the province not only in terms of lost economic opportunity but also in terms of opportunity cost.
E. Getting To 80
Ontario has an important role to play in reducing Canada's overall GHG emissions. The province is the second highest contributor of GHG emissions in Canada and has contributed about 171 megatonnes of carbon dioxide equivalent (Mt CO2 eq) in 2011. With an 80% emission reduction target from 1990 levels by 2050, Ontario will have to create aggressive policies to meet its target. These policies will not only result in the reduction of GHG's in Ontario, but they will profoundly impact our economy and society. In 2011, Ontario's road transportation sector accounted for 45 Mt or 24 percent of total emissions. Of this, 31.1 Mt is associated with light vehicles (15.5 Mt) and light trucks (15.6 Mt), the remainder comes from commercial, fleet and other road vehicles. In the personal transportation sector alone (LDGV and LDGT), Ontario needs to reduce its emissions to approximately 5.2Mt by the year 2050 from the 1990 levels of 26Mt. Emissions from LDGV was 18.6Mt in 1990 and with the 80% emission reduction goal, emissions from LDGV would need to be reduced to approximately 3.7Mt.
In 2050, Ontario is projected to have approximately 6 million LDGV on the road. As highlighted in the chart below, the CAFE Standards play a significant role in reducing emissions from LDGV. Existing CAFE standards are only in force to 2025. Our analysis in Figure 58 assumes per vehicle ICE emissions are achieved in the year 2025 and then remain constant until the year 2050. In addition to LDGVs increasing in efficiency, EVs would need to increase their numbers in Ontario's growing vehicle population. This combination reveals that we could reach our overall 3.7 Mt target (80% reduction) for LDV around the year 2046. In this scenario approximately 85% of passenger vehicles would have to be EVs, approximately 5 million vehicles. Our analysis assumes per vehicle ICE emission standards are achieved in the year 2025 and then remain constant until the year 2050.

Again this analysis does not include LDGT, which is a growing portion of the personal transportation fleet in the province. As previously mentioned, a reduction from approximately 7.5Mt to 1.4Mt would be needed for LDGT. The chart below provides a glimpse into the potential amount of trucks on Ontario's roads in 2050 and the resulting emissions.

As the chart depicts, LDGT continue to be a large proportion of the vehicles used for personal use. In addition, the emissions from trucks continue to grow, even with the application the current emission standards. This scenario may or may not be realistic, based on a number of unpredictable factors such as gasoline prices, consumer behavior, urban design, carbon taxes, public transit, etc. However, it does show the reality of what must change in order to meet our emission reduction targets. The fact is the number of trucks on the road must dramatically be reduced in order to tackle the emissions coming from the personal transportation sector.
EV Adoption Scenarios
In our research we examined in detail four conservative EV adoption scenarios for Ontario in order to gain fundamental understanding of the key economic and labour market drivers and their interrelationships. The Getting to 80 Calculator uses the baseline data created by Econometric Research Limited to allow you to create scenarios; an easy way to apply other product adoption rates to EV's in what-if scenarios. This is not meant to be predictive. Obviously, 2050 is a long way off for accurate forecasting. However, the hope is it will help identify the major drivers of change and guide policy makers to examine various scenarios and engage people in the conversation.

From this baseline scenario, the various inputs and outputs from the impact analysis were broken down into per vehicle metrics, comparing gasoline vehicles to electric vehicles. These individual metrics were formulated into a dynamic and interactive model, named the Getting To 80 Calculator, allowing the user to dive into various EV adoption scenarios. In addition to the LDGV baseline metrics, the Calculator includes LDGT in the total vehicle population and emissions calculations.
As a society we need to come to terms with the fact dramatic transformative change will have to be pushed hard to achieve timely environmental change. What our research shows is that contrary to commonly received wisdom, the changes can have very healthy economic, environmental, and social outcomes. The GT80 Calculator allows flexible scenario modelling and also has several pre-set scenario buttons which give unique what-if glimpses to possible futures based on technology penetrations rates for other disruptive products such as colour TV and the mobile phone when applied to EV's. In other words, what would it look like if EVs were adopted at the same rate as the mobile phone or as the colour TV?
In addition to the 5% by 2050 base line scenario used in the ERL economic impact analysis, we have included: the mobile phone, telephone, colour TV, and the automobile. The GT80 Calculator uses the first 40 years of the U.S adoption rate for the various technologies, starting as early as 1900. When you select the various scenarios, the scenario outcomes are plotted on a graph in the GT80 Calculator, see Figure 60. For example, if you select the EV adoption as colour TV pre-set, the Calculator will apply the historic TV adoption rate to EV's and display the number of EVs that would displace ICE vehicles, the resulting emissions, the manufacturing and operation economic impacts, including employment and tax revenues.

The calculator also provides the economic impact analysis inputs from the ERL model, which can be manipulated to display the impact analysis outputs, such as emissions, employment and taxes. These outputs are then plotted on the chart on the right, see the figure below. You are able to see how these outputs change based on the various EV adoption rate scenarios you can select. Some of the various scenarios and their implications are discussed below.[104] Additional scenarios can be created on an individual basis by accessing the GT80 Calculator, available at www.driveelectric.ca.
Emission Reductions from EV Adoption
As an exercise, WEC went through three of the various EV scenarios in the GT80 Calculator looking at what the input values would have to be in order for Ontario to reach its emission reduction target of 80% in the personal transportation section by the year 2050. Keep in mind, the GT80 Calculator does include emissions from LDGT, including the emission reductions from CAFE Standards. The emissions in the GT80 Calculator only include the emissions from operating the vehicles, and do not include manufacturing the component. The assumption was used that each EV emits 422Kg of CO2/year, compared to 4,192 Kg of CO2/year for an ICE vehicle. This is based on the electricity mix in Ontario in 2012 and based on an annual distance of 18,000km/year.
Below are the three scenarios we reviewed in the GT80 Calculator; 5% base case, telephone and mobile phone.
Base Case: 5% Adoption

The first is one of the base case scenarios. It is a low ambition case where 5% of all cars on the road in 2050 are EVs. In this scenario we do see emission reductions until the year 2025, mainly because of the CAFE Standards. The number of EVs on the road, however, is such a small
proportion of the total number of vehicles on the road that Ontario would not be able to meet the 80% emission reduction target unless the average annual distance driven by each vehicle, including ICEs, was to reduce from 18,000km/year to approximately 3,500km/yr; or distance driven remains constant but the annual car and truck growth rate dipped into the negatives, around -2% respectively, then we would reach our emission target in 2050. These outcomes highlight the significant need for increased public transit access and usage, the development of smart city planning and the expansion of car-sharing throughout the province. In addition to the low emission reductions in this scenario, the manufacturing economic impacts are sparse. There is a spike in employment, tax revenue and the economic impact between 2015 and 2020 but then it drops down and levels off because EVs have reached the 5% penetration rate. As for the annual operating impacts; economic, employment and tax revenue spike in the year 2020 and maintain a steady incline as the number of EVs slowly grow.
EV Adoption as US Telephone
When the telephone was first introduced to U.S households in 1900, it took almost 45 years to reach a 50% penetration rate. This adoption rate was applied to EVs to see its impacts on vehicle population, emissions, employment and economic impact, from 2011 to 2050. In this scenario, Ontario would see a 36% EV adoption rate by the year 2050. That is around 5 million EV's on the road out of the projected 13.5 million vehicles on the road by 2050 based on the S-Curve growth rate. With this many EVs on the road we would see an emission reduction to approximately 22Mt in the personal transportation sector.
Although we do not reach our emission target of 6Mt in this scenario, there is significant positive economic impacts and job creation in both the manufacturing and operations of EVs. Figure 63 displays the annual impact of manufacturing EVs in Ontario under the US telephone adoption scenario. Overall, manufacturing EVs provide a net positive economic impact to the Province including tax revenue generated and the number of jobs created in comparison to manufacturing and operating internal combustion engine vehicles. There is a reduction in impact in the year 2045, again keeping in mind that this follows the same adoption rate as the telephone in the United States, which occurred just after 1930. However, this temporary decrease recovered and now more than 90% of households have a telephone in their home.

EV Adoption as U.S Mobile Phone Adoption
Another scenario created using the GT80 Calculator showcases the outcome of rapid technology adoption. It took about 20 years for mobile phones to exceed the 80% penetration rate in U.S households and if we apply this same adoption rate to EV's starting in 2011, the economic and emission impacts are dramatic. If EV's took off as fast as mobiles phones did, 100 percent of Ontario cars on the road would be EVs by the year 2034; that is over 10 million electric vehicles. Ontario would also reach its 80% emission reduction target in the personal transportation sector by the year 2030. This type of EV growth implies there be significant incentives for vehicle purchases, new battery technology develops or perhaps significant increase in gas prices.

With 10 million vehicles on the road, there are tens of thousands of jobs created in the next 40 years. Operating impacts alone creates up to half a million jobs by the year 2050, with a large portion of these jobs becoming available around the year 2030. Under this scenario, adoption occurs so quickly that Ontario, including government, employers and educational institutions would need to invest significant time and money to ensure; the infrastructure was in place, employees had the essential skills and programs were available for individuals to enroll into.
This is just a brief summary of some of the possible scenarios presented in the Getting To 80 Calculator Tool. You can see and create other scenarios online at www.driveelectirc.ca
F. Conclusion
The Province has set a vision for emission reductions, economic stimulation and education potential; however, they have not considered the impact and requirements to achieve these goals. One specific goal is reducing Ontario's emissions by 80% by the year 2050. Windfall Centre researched how Electric Vehicles could play a role in addressing Ontario's emission reductions targets, and its impacts on Ontario's economy and labour markets. If one thing is clear from this report, it's that Ontario has much work to do. EVs have the potential to dramatically reduce our emissions from the personal transportation sector while stimulating the economy. This is not possible under current policies. Ontario needs drastic measures to increase EV adoption and secure automotive manufacturing to ensure a skilled and educated workforce. The Province needs to build upon our existing educational programs, our renewable electricity generation sources and our skilled citizens to take advantage of the growing electric mobility movement.
The Province should not bear the burden of this task alone. It is also the responsibility of educational institutions, professional associations, employers and various levels of government to ensure the systems, policies and incentives are in place. The next section is a list of recommendations which these various players should follow to ensure Ontario can meet its professional development goals, economic opportunities, labour market development needs and environmental and emission reduction plans/goals.
Windfall Centre is not stating that EVs are the only way to reduce our emissions, many measures such as increased access to public transit and urban planning will play a significant role. Again the economic impacts discussed in this report are from the adoption of EVs in place of LDGV in Ontario. The potential is even greater when you consider Ontario automotive exports to the United States, the growing impact of LDGT and the supporting infrastructure for EVs. The scenarios we presented are only hypothetical to display the true reality of our situation and to demonstrate the dramatic actions we have to take in order reach our 2050 vision. They are meant to be a conservation starter and to highlight what we stand to lose if we fail to act.
G. Recommendations
Ontario should formulate and implement EV enhancing policies to ensure success of the EV industry. All stakeholders, including the Ontario government, non-profit organizations, educational institutions, automotive manufacturers, private organizations, R&D centers and all employers in the EV supply chain have to work collaboratively to identify labour market trends, provide up-to-date labour market information, train the existing and future workforce, and provide requisite conditions for the success of EV industry in Ontario. Attached are some recommendations for educational institutions, the EV industry and the Ontario government.
Recommendations for the Educational System
Ontario needs to increase interest and enrollment in sciences, technology, engineering and mathematics (STEM) in schools, universities and colleges by carrying out the following:
Recommendation 1
Change the image of STEM courses and careers. The prevailing stereotype is that scientists or professionals in sciences are thought of as people who work in isolation and lead unexciting lives and that the science professions are suited for people who are aloof and prefer to work in non-collaborative environments. It is important to change this image at a very young age by introducing students to a number of opportunities to help shape a more positive impression of STEM-based professions. For example, Communitech[105] in Kitchener/Waterloo runs a program through which science professionals or other professionals with science training give talks at elementary and high schools to engage students and to provide a positive image of the sciences. Perceptions can also be altered through STEM centered job fairs and job shadowing, positive portrayal in media, and emphasizing that sciences and science careers are not about social isolation but social engagement, scientific discovery, and travels to other locations for conferences and project management.
Another way to stimulate interest is by introducing multi-disciplinary and cross curriculum approach in class rooms[106]. Chemistry or mathematics doesn't have to be taught in isolation but mathematics can be taught with history, for example, in order to enhance both reading and numeracy skills. It is important to teach students how science is connected to real world by integrating science with non-science subjects. Educational institutes should work with electric mobility associations, Windfall Centre and the automotive industry supply chain to determine best practices to introduce multidisciplinary curriculum for students.
Recommendation 2
Review course graduation requirements for high schools[107]. In Ontario schools, sciences past grade 10 are voluntary and the uptake in sciences is low after this mandatory time. By not enrolling in voluntary STEM courses, students limit their college and university program options and consequently their career options. Some students have to return to high school to take science courses in order to fulfill certain requirements for college and university programs. It is important that schools review high school graduation requirements by either making STEM courses mandatory for high school diploma, making STEM involuntary up to grade 11 or by encouraging uptake in STEM.
Recommendation 3
Improve awareness of career choices for school, college and university students[108]. There is some disconnect between STEM learning and STEM career opportunities. It's important that students learn that STEM education develops reasoning and problem solving skills that can translate into STEM as well as non-STEM careers. For example, an undergraduate degree in chemistry and biology could lead to a career in the pharmaceutical industry, not just as a chemist or a biologist but also as a marketer for a pharmaceutical company. Schools, colleges and universities have to collaborate with the industries, unions and professional bodies to improve awareness of career choices. These collaborations could be in the forms of partnerships, industry led student career seminars, etc. The EV industry can provide lots of career opportunities, not just in sciences and technology but in other areas as well. It is important that schools, colleges and universities communicate these opportunities to its students.
Recommendation 4
Review current curriculum in both schools and universities. STEM curriculum in schools, colleges and universities focuses on the traditional text book learning and at times not compatible with real world learning. Class room leaning should be combined with real world learning by providing students with internships and co-ops especially in the EV industry and its different industry sectors. It's important to expose students to the industry early on in school, college and universities in order to provide them with relevant experience, broaden their career options, and provide them with most updated and current practical training for the EV industry. Classroom curriculum should be designed in collaboration with the EV industry, and its various sectors such as utility, R and D, and automotive manufacturing.
Ontario schools have recently started offering Specialize High School Majors (SHSM) in about two dozen different subject matters. SHSM let grade 11 and 12 students focus on a career path while fulfilling their requirements for the Ontario Secondary School Diploma. One of these areas is transportation, which would be the ideal opportunity to include electric vehicles and electric mobility into the curriculum. SHSM provide students with the opportunity for experiential learning, hand on skills, and relevant work experience with industry employers. However, not all SHSM are available in all schools in Ontario. Where possible, these subjects should be expanded too all school boards and schools in the province.
Recommendation 5
Educational institutions should hire STEM trained professionals. The hiring of professionals who hold Masters and Doctorate degrees in math or physics can provide resources, training and support educators to evolve teaching practices, including the use of emerging technologies. Such an interaction would be a lot more interesting than an interaction with a teacher who hasn't worked in the industry.
Schools should also encourage their teachers to earn specialized degrees in STEM and also gain practical industry experience. Subject specialization and industry experience would make them more effective as teachers and they would be able to generate more interest from their students in science subjects.
Recommendation 6
Analyze specific reasons for lower enrolment and transfers of students from science majors to non-science majors in universities in Ontario. For example, many students are discouraged from pursuing a computer science major because they find introductory programming hard and boring. The difficulty experienced by some students in learning computer programming languages is often a factor in their decision not to pursue computer science as a major in university or college. Universities as well as colleges should make computer science courses fun and make beginner computer programming languages less intimidating. Carnegie Mellon University uses a visually oriented programming language called Alice as a beginner programming course. It has 3D effects, and a drag and drop integrated development environment that fixes syntax errors[109]. Another example would be to create youth based competitions, such as AUTO21, which would increase the technological skills and knowledge of youth while promoting innovation in Ontario's EV, auto and other industries.
Additionally, Post-secondary institutions should stop emphasizing programming proficiency and look for applicants and students who are overall high achievers and have broad interests, diverse perspectives and potential future leaders.[110] If post-secondary educational institutions can broaden their admission requirements and not base their decisions of admissions and program enrolments on programming efficiency, enrolments in computer sciences and related subjects and programs could be improved.
Many students also don't pursue computer sciences because they are under the impression that computer or IT related jobs are being outsourced. Regardless, there are still many opportunities in computer sciences in Ontario. Many technology start-ups in Ontario require STEM training. At both college and university levels, issues that discourage students from pursing STEM related programs and courses should be addressed through panels, forums and surveys.
Recommendation 7
Various educational institutes in Ontario, like Fanshawe and Durham Colleges, provide skills training and apprenticeship programs in 156 trades in Ontario. The skills trade education providers should collaborate with the EV industry to determine the type of skills training that would be required in the coming years. The EV industry would require training in electronics, electrical equipment, and electrical diagnostics. For example, trades such as automotive service technicians, auto body repair, electrical systems technicians should also be trained in theoretical and practical applications in electronics and electrical diagnostics. Electricians in the Utility industry should be trained in diagnostic tools, Geographical Information Systems (GIS), etc. IT network technician will also need to add EV electronic systems and diagnostics to their repertoire.
An example on how to implement this would be the Dual Education System, such as the one in Germany and other European countries. The Dual System combines apprenticeships in a company with vocational education at a vocational school. This allows the student to gain relevant work experience and the employer can gain a knowledgeable and skilled employee at the end of the training.
Recommendations for the Provincial Government
Recommendation 1
Formulate and implement policies to not only encourage EV adoption by purchasing new vehicles but also to encourage the exchange of existing ICEs for EVs. Ontario's target to have 5% of new passenger vehicle sales as EVs by 2020 is insufficient to achieve the overall target of 6 Mt from personal transportation by 2050. Such policies could include tax credits, various purchase plans, electric battery sharing, replacement and pay per usage options, penalties on older ICEs and if emissions of certain levels are exceeded by ICEs. The Province should also carry out analysis of policy and programs in place in other jurisdictions (Norway for example) that have had success in increasing EV adoption.
Recommendation 2
Another very important factor for increasing EV adoption is wide spread public education. If Ontarian's are not educated about EVs and our climate situation, there will continue to be a barrier to EV adoption. Mainly public education and support for EV owners has been left to professional not-for profit organizations such as Electric Mobility Canada, online social media groups, and associations for individuals. If Ontario wants to meet its emission reduction targets, continue to have a strong automotive manufacturing sector and reduce its reliance on imported fossil fuels, the Province needs to take a leadership role to educate and engage the community on electric mobility.
Recommendation 3
Provide bridging income programs specific to the EV industry. Currently Ontario offers Ontario Bridging Participant Assistance Program (OBPAP) to internationally trained workers. This program could be expanded to include Canadian trained workers who are interested in an EV industry career and skills upgrades for EV industry career. Additionally, new bridge programs should be introduced that not just provide a one-time bursary as in OBPAP program but also monthly or continuous financial support to workers while they train or retrain for various EV sectors such as utilities, manufacturing, and R&D, such as MTCU's second career tuition program for recently laid off workers which includes various occupations. MTCU could expand this program to specifically include EV occupations such as electrical engineering, computer sciences, electronics engineering/electronics technician, physical sciences such as physics, chemistry, etc.
Recommendation 4
MTCU should work with credential assessment organizations, apprenticeship authorities, employers and Citizenship and Immigration Canada to recognize the credentials and skills of immigrants and new Canadians as they pertain to high skill jobs needed in the EV sector. Many new Canadians possess the skills and education required to work in the high skilled jobs and is a critical asset to reducing the skill and training gaps. Currently, immigrants or new Canadians can apply for assessments and evaluations of their overseas credentials, for example in engineering, before they come to Canada. However, it is timely and costly. Global Experience Ontario is a resource centre to help internationally trained individuals gain professional employment in Ontario. One professional area which they help internationally trained individuals become certified is a Certified Engineering Technologist. They even provide labour market info and a complete career map with Ontario Association of Certified Engineering Technicians and Technologists. The steps are long and in the career map, which is from 2011, there is no mention of opportunities or encouraging individuals in the electric mobility or transportation sectors.
Programs such as Ontario's Nominee Program, helps provide graduate international students to live permanently in Ontario, however they do not require a job offer to be successful in their application. It is suggested to connect these types of programs with employers who could offer relevant Canadian work experience to student immigrants. MTCU needs to ensure the appropriate training and assessment criteria are available to ensure the success of the EV labour market. Provincial professional development goals, economic opportunities and labour market development needs to coincide with environmental and emission reduction plans/goals.
Recommendation 5
Identify existing EV clusters in Ontario and create an inventory pertaining to R&D, manufacturing and distribution, among other things. Ontario should also identify potential EV clusters and formulate policies and programs to foster growth in these potential clusters and study the economic and environmental impacts of these clusters on their region and their neighbourhoods.
Recommendation 6
Commit more resources and facilities to make Ontario an EV industry R & D and manufacturing hub. Increased partnerships and collaboration with public organizations, universities, research institutes, non-profit organizations and private companies, not just in Canada but in other jurisdictions internationally, will make this happen. These collaborations could be in the form of panels, forums, national and international events and conferences. For example, in Nova Scotia's ocean technology sector, the Department of Economic and Rural Development and Tourism (ERDT) organize Speed Dating
events between companies and universities.
Ontario should also collaborate with private sector companies such as Tesla and leverage Ontario's automotive manufacturing and R and D experience. The Ministry of Research and Innovation, Ministry of Training, Colleges and Universities, Ministry of Economic Development, Employment and Infrastructure, and Ministry of Environment and Climate Change have opportunities here to collaborate and foster relationships with non-public sector organizations. An example of collaboration in Ontario is the RX350 project, which over 15 companies in Ontario came together to redesign the Lexus RX350 to incorporate connected car technologies into the vehicle. The car was then toured around to various automotive manufacturing locations in Ontario and the U.S. It proved that high tech innovation and product development is possible in Ontario, but not without collaboration amongst the various high tech companies. Ontario should continue Research and Development on smart grid, smart charging, energy storage solutions, and cold weather testing. Ontario should also be more aggressive in its policies to pursue EV manufacturing because without it, Ontario is unlikely to attract design activities.
Recommendation 7
Ensure successful transition of workers that may be affected by the EV industry. Programs and policies should be put in place to ensure workers with skills that may become obsolete or outdated are able to train successfully and take advantage of the new economic opportunities of the EV industry.
In the EV industry, work of various sectors, like the utility sector, for example, would have to be better trained in energy storage, smart grid technology, geographical information systems (GIS), and communication skills. Automotive repair workers would have to be trained in EV repair, EV computer systems and technology, electrical diagnostics and diagnostic tools. MTCU should collaborate with Electric Mobility Canada (EMC), unions, and educational institutions to ensure training and skills upgrade programs are in place. This could be achieved by using hands on training facilities where training can take place on the newest and future technologies. These could be incorporated into existing innovation and research centres at the post-secondary or trade association level. MTCU should work with Ontario's Employment and Social Services Employment Centres to educate users of these employment centers about transition opportunities in the EV industry.
MTCU should strengthen its alliances with the automotive industry and its supply chain to make sure workers acquire new skills that are transferrable to the EV industry and workers who will be laid off have ample opportunities to train. MTCU should proactively educate transitional workers about EV industry though its Second Careers program, Targeted Initiative for Older Workers, Ontario Self Employment Benefit programs, etc.
Recommendation 8
As highlighted earlier, surplus baseload generation will create conflicts with EV charging. Thus, Ontario needs to reassess its Long Term Energy Plan and move towards electricity generation sources that will be more flexible for EV adoption, such as renewable energy. This will need to happen in collaboration with Ontario's dozens of electrical utilities. Not only will the utilities be involved in updating the infrastructure, they will be actively involved in encouraging optimal charging times. In addition to optimizing the Province's electricity generation, renewable energy could be a direct tie into the EV charging infrastructure. For example, solar power could be integrated with parking garages at large retail centres or public transit stations.
Currently, Ontario's Feed In Tariff (FIT) program does not support solar roof top projects for those types of applications. Previously, roof top projects had to be constructed on existing buildings. In response to a directive from the Ministry of Energy, the Ontario Power Authority has created an Unconstructed Solar Rooftop Solar Pilot (USRS), where buildings which have not been constructed can still develop projects to be considered in the FIT program. However, despite this pilot project, an USRS pilot is not eligible if one of its main purposes is to support a solar power installation or to provide shelter from the sun. This definition therefore excludes constructing solar canopies in parking lots. This definition should be changed in order to have a more direct connection between renewable energy generation and electric mobility charging infrastructure.
Recommendation 9
MTCU and other Ministries should continuously monitor and review trends in the EV industry in order to provide the most up to date labour market information in this sector. The EV industry could experience demand and employment fluctuations, especially in the automotive industry, where economic and labour changes in the U.S. and Mexico could impact labour demand and output in Ontario. Ontario should ensure that this information is readily available and accessible to employers and educational institutions. Ontario should collaborate with all stakeholders: schools, universities, colleges, industries, employers and non-profit organizations to improve data collection methodologies, minimize skill mismatches and to adequately train workers in the EV industry.
MTCU should engage Active Labour Market Polices (ALMP) which is used successfully in Denmark[111]. ALMP eases the transition from unemployment and inactivity to work by encouraging, improving and supporting job search through frequent counselling, and by improving qualifications and employability through skills upgrading and vocational training and education. Both on job and class room training is specifically tailored to employer and labour market needs. ALMP focuses on accelerated job matching rather than human capital development. Attendance in the active labour market programs is compulsory and training is geared towards sectors with good job prospects and targeted towards low skilled unemployed youth. ALMP measures are localized; local and regional authorities and employment councils have significant autonomy in drawing up plans and objectives to ensure job seekers' integration into the labour market.
Recommendation 10
Broaden the application of its apprenticeship program and study apprenticeships programs of other jurisdictions that have had success. For example, elements of German apprenticeship programs and Danish labour market policies should be studied in order to find relevant applicability for Ontario's EV industry. Germany's dual apprenticeship program successfully integrates both class room training and paid apprenticeship. Students spend three days as an apprentice and spend at least 12 hours in a class room learning about the theoretical aspects of their vocation. The dual apprenticeship program provides large scale and high quality training, high level of involvement between all stakeholders: education system, public sector, corporations and various social partners such as trade unions and local chamber of commerce. Most importantly there is high level of integration between the labour market and the education system, and all stakeholders collectively engage in training provisions and curriculum development. Furthermore, the skills acquired through apprenticeships are transferrable and also provide a foundation for further training and education.
Recommendations for the EV Industry/ Employers
Recommendation 1
Various sectors within the EV industry need to clarify the connection between the outcomes of STEM learning and various career opportunities available across the industry. Employers should engage with education providers, non-profit organizations, industry and trade associations to collaborate on labour market data and information, and to offer co-op positions, internships and support apprenticeships as a way to recruit employees to the sector. Similar to the mining, oil and gas industry, the EV industry should promote itself to communities, regions, schools, universities, and communicate its successes, challenges and potential.
Recommendation 2
Proactively collaborate with the Ontario government, industry and trade associations, businesses, educational institutions, and non-profit organizations to identify the skills and experience needed to prepare their workforce for the future EV industry. Employers could also request tools to assist with re-training such as tax incentives, training programs, grants, funds, etc. The industry should also conduct competency assessments of its employees and members to determine their preparedness for foreseeable skills and educational requirements, and encourage relevant training.
Recommendation 3
Collaborate with universities, colleges and schools to design curriculum and be specific with educational providers about their recruitment needs and work with educational providers to ensure that employer's specific skills and educational requirements are met. For example in Germany, the dual apprentice training program involves active participation from the employer in theoretical curriculum development for schools and educational institutes.
In Canada, some IT companies collaborate with colleges to design their curriculum to ensure that when students graduate, they are prepared for the workforce. Specific skills sets and education required should be communicated by the industry to the educational institutions, and the industry should check with the institutes if they are able to prepare enough graduates and workers. Industry should actively collaborate with educational institutions to ensure that there are no skill mismatches when students graduate or when workers complete their training.
Recommendation 4
Employers in Ontario have a much bigger role to play in training, retaining and retention of employees. Employers should invest in providing more hands on and job specific training to workers and recruits in order to minimize skill mismatches. Also, unions and industry organizations should take a more active role in training and retraining of employees to ensure a flow of good and highly trained workers for EV industry. There is some consensus amongst certain stakeholders, such as academic institutions and industry associations, that in general employers in Canada do not spend enough money, time and resources in training their employees.
Additionally, employers need to take a proactive approach in training their workers and collaborate with the Ontario government to identify upcoming training needs, skill requirements and industry dynamics that have been identified. Gartner Consulting[112] has produced reports and analysis on upcoming industry trends in technology; ICT companies train or update themselves based on these trends and the EV industry should train its workers proactively based on upcoming trends.
The Ontario auto industry is already in the process of electrification of vehicles with other technologies and solutions such as automated vehicles. The EV industry would require additional skill training in electronics, sensors, cameras, computer software, etc. As many cars will be hybrids, those that have a traditional ICE and battery components, it would be important for employers to proactively train their workers to work in traditional ICE, hybrid and EV environments.
H. Appendices
Appendix A: Glossary of Terms
- According to United Nations Intergovernmental Panel on Climate Change (IPCC), the road transportation sector consists of the following categories: light duty gasoline vehicles, light duty gasoline trucks, heavy duty gasoline vehicles, motorcycles, light duty diesel vehicles, light duty diesel trucks, heavy duty diesel vehicles, and propane & natural gas vehicles.
- The personal transportation sector is a subset of the road transportation sector and consists of light duty gasoline vehicles (LDGVs) and light duty gasoline trucks (LDGTs). For the purpose of this report, and the scope of our research, we have focused only on Light Duty Gasoline Vehicles (LDGV) in the personal road transportation sector in Ontario.
- For the scope of this report, we have focused on Electric Vehicles technology, which is defined as a Battery Electric Vehicles (BEV). We have excluded Plug-in Hybrid Electric Vehicles (PHEV) in our analysis.
- Battery Electric Vehicles (BEV): Battery Electric Vehicles operate entirely on an electric motor powered by a battery. This battery is charged through an electrical outlet.
- Electric Vehicles (EVs): As used throughout the report EV refers the BEV definition
- Internal Combustion Engine (ICE): An engine that generates motive power by the burning of gasoline, oil, or other fuel with air inside the engine.
- Light Duty Gasoline Vehicle: (LDGV): A motor vehicle which includes primarily passenger cars.
- Light Duty Gasoline Truck (LDGT): A motor vehicle which includes vans, sport utility vehicles and pick-up trucks.
- Plug-in Hybrid Electric Vehicle (PHEV): Plug-in hybrid electric vehicles have additional battery capacity and can be charged through an electric outlet when parked. Plug-in hybrids are able to travel in all-electric mode at higher speeds and for extended distances without using the combustion engine.
- The Ministry: Ministry of Training Colleges and Universities
- WEC: Windfall Ecology Centre
Appendix B: Partner and Contribution Acknowledgements
Windfall Centre would like to thank the following organizations for their participation and contribution to our project:
- Ministry of Training, Colleges and Universities
- World Wildlife Fund
- Powerstream
- Plug'n Drive
- Ministry of Transportation
- Workforce Planning Board of York Region
- Constructive Public Engagement
- Econometric Research Limited
- McMaster Institute for Transportation and Logistics
- Electric Mobility Canada
- Automotive Parts Manufacturers' Association
- Global Automakers of Canada
- Ministry of Economic Development, Trade and Employment
- Georgian College
- York University
- Let's Talk Science
- National Energy Board
- University of Ottawa
- Canadian Tax Payer Federation
- Canadian Center for Energy Information
- Manitoba Electric Vehicle Association
- Environment Canada
- Auto Research Center at University of Windsor
- Bank of Canada
- Communitech
- Schneider Electric
- CrossChasm
Appendix C: Assumptions
ERL and Windfall Centre used various assumptions to determine potential impacts in various scenarios, they are:
- All LDGV were made in Ontario. This was to demonstrate the potential gains as well as the loses in automotive manufacturing and other impacted sectors.
- LDGT growth rate is 2% and LDGV growth rate is 1% with an applied S-Curve where the growth rate slowly decreases until the year 2050. This growth was used to ensure that vehicle population did not outgrow the actual population of Ontario and assumed that with rising gas prices, increase in access to public transit, etc, that overall vehicle population would decrease.
- Gas prices are $1.23/litre.
- The average kilometres driven per vehicle is 18,000km/year.
- 100% of vehicle charging occurred during on peak hours ($0.11/kWh).
- Travel per kWh of charging was 4.67km
- Price differential between EVs and LDGVs was $7500/vehicle
- Annual emissions were 422kg/EV based on Ontario's electricity mix from 2011.
- Annual emissions were 4192kg/LDGV
- A total of 24 kWh are required to charge a vehicle to travel a distance of 112 km.
- Current total Ontario Electricity Generation Capacity is 26935 MW
- Off-peak charging is assumed to be done in 6 hours at night.
- There is a distinction between construction (temporary) and operating (permanent) employment.
Appendix D: References
- Aguirre, K., Eisenhardt, L., Lim, C., Nelson, B., Norring, A., & Slowik, P. a. (2012, June). Lifecycle Analysis Comparison of a Battery Electric Vehicle and a Conventional Gasoline Vehicle. Retrieved from UCLA, Institute of the Environment and Sustainability: http://www.environment.ucla.edu/media/files/BatteryElectricVehicleLCA2012-rh-ptd.pdf
- AZD Azure Dynamics. (2010). About AZD. Retrieved from Azure Dynamics: http://azuredynamics.gssiwebs.com/about-azd/about-us.htm
- Bank of Canada. (2012). Financial Markets Department Year Average Exchange Rates. Retrieved from Bank of Canada: file:///C:/Users/Jen%20Slykhuis/Downloads/nraa-2012%20(1).pdf
- Becker, Thomas and Sidhu, Ikhlaq. (2009, August). Electric Vehicles in the United States: A New Model with Forecast to 2030. University of California, Berkeley: Center for Entrepreneurship and Technology.
- BET Services Inc. (2014). About Us. Retrieved from BET Services: http://www.betservices.com/about-us.html
- ECO Canada. (2010). Defining the Green Economy. Calgary: ECO Canada.
- Electricty Human Resources Canada. (2013). Renewing Futures: Meeting the Human Resources Needs of Canada's Renewable Electricity Industry. Ottawa: Electricity Human Resources Canada.
- Electric Mobility Canada (EMC). (2010). Canadian EV Industry. EMC.
- Electric Mobility Canada (2013). Vehicle Electrification in Canada and Why Dealers Should Care. Retrieved from Electric Mobility Canada: https://emc-mec.ca/eng/pdf/EMC_CADAsummit_14feb2013.pdf
- Electric Mobility Canada (2013). Public Charging Infrastructure in Canada: A status report for Natural Resources Canada. Retrieved from Electric Mobility Canada: http://emc-mec.ca/eng/pdf/EMC_EVSElocations_NRCan_R2.pdf
- Electric Power Research Institute. (2009, May). Regional Economic Impacts of Electric Drive Vehicles and Technologies: Case Study of the Greater Cleveland Area. Retrieved from: http://www.issuelab.org/resource/regional_economic_impacts_of_electric_drive_vehicles_and_technologies_case_study_of_the_greater_cleveland_area
- Electrification Coalition. (2010). Economic Impact of the Electrification Roadmap. Retrieved from: http://www.electrificationcoalition.org/sites/default/files/SAF_1249_EC_ImpactReport_v06_proof.pdf
- Electrovaya. (2014). Retrieved from Electrovaya: Powering Mobility: http://www.electrovaya.com/company/master/Default.aspx
- Environment Canada. (2013). National Inventory Report 1990-2011: Greenhouse Gas Sources and Sinks in Canada — Part 3. Retrieved from Environment Canada: http://publications.gc.ca/collections/collection_2012/ec/En81-4-2010-3-eng.pdf
- Environmental Commissioner of Ontario. (2014). Annual Greenhouse Gas Emission Report 2014. Retrieved from: http://www.eco.on.ca/uploads/Reports-GHG/2014/GHG2014%20Looking%20for%20Leadership.pdf
- Government of Canada. (2012, December). Regulations Amending the Passenger Automobile and Light Truck Greenhouse Gas Emission Regulations. Retrieved from Canada Gazette: http://www.gazette.gc.ca/rp-pr/p1/2012/2012-12-08/html/reg1-eng.html
- Hawkins, T. R.-B. (2013). Comparative Environmental Life Cycle Assessment of Conventional and Electric Vehicles. Journal of Industrial Ecology, 17, 53-64.
- Hill, N. (2013, July 11). Life-Cycle Assessment for Hybrid and Electric Vehicles. Retrieved from Ricardo AEA - LowCVP Annual Conference 2013 : http://www.ricardo-aea.com/cms/assets/Documents-for-Insight-pages/Transport/08.-LowCVP-conference.pdf
- HSBC Global Asset Management. (2011, September). What are Emerging Markets? Retrieved from HSBC Emerging Market Funds: https://www.emfunds.us.assetmanagement.hsbc.com/investing-in-emerging-markets/content/what-are-em.fs
- Independent Electricity System Operator. (2014). Power Data. Retrieved from ieso: Power to Ontario. On Demand: http://ieso-public.sharepoint.com/
- Independent Electricity System Operator. (2014). Global Adjustment. Retrieved from ieso: Power to Ontario. On Demand: http://ieso-public.sharepoint.com/Pages/Ontario's-Power-System/Electricity-Pricing-in-Ontario/Global-Adjustment.aspx
- Keenan, G. (2014, February 14). Jobs on the line: A new era for autos dawns in Mexico. Retrieved from The Globe and Mail: http://www.theglobeandmail.com/report-on-business/mexican-powerhouse-adds-two-new-car-factories/article17043499/
- Kubursi, D. A. (2014). Plug-In-Electric Vehilce Labour Market Economic Modelling and Impact Analysis. Econometric Research Limited.
- Library of Parliament. (2013). Exchange Rate Fluctuations and the Competitiveness of the Canadian Manufacturing Sector. Ottawa, Ontario, Canada. Retrieved from http://www.parl.gc.ca/Content/LOP/ResearchPublications/2013-19-e.pdf
- Meade, Douglas. (1994). The Impact of the Electric Car on the U.S Economy: 1998-2005. Retrieved from: http://www.inforum.umd.edu/papers/wp/wp/1994/wp94007.pdf
- Miner, R. (2010). Jobs Without People, People Without Jobs, Ontario's Labour Market Future. Miner Management Consultants.
- Ministry of Training, Colleges and Universities. (2014, 02 25). What new occupations and industries are emerging. Retrieved from Ontario Ministry of Training, Colleges and Universities: http://www.tcu.gov.on.ca/eng/labourmarket/ojf/upComingJobs.html
- Munro, J. S. (2013). The Need to Make Skills Work: The Cost of Ontario's Skills Gap. Ottawa: The Conference Board of Canada.
- National Electrical Trade Council. (2014). Electric Vehicle Infrastructure Training Program. Retrieved from Canadian Electrical Contractors Association: http://www.ceca.org/netco/EVITP.asp
- Natural Resources Canada. (2010). EV Technology Roadmap for Canada. Electric Mobility Canada.
- Northwest Economic Research Center. (2013, January). Oregon's Electric Vehicle Industry. Portland State University. Retrieved from: http://www.pdx.edu/nerc/sites/www.pdx.edu.nerc/files/NERC%20EV%20Industry%20Final%20Report%202013.pdf
- Ontario Automotive Communities Alliance. (2013). Why Ontario? Retrieved from Ontario Auto Alliance: http://www.ontarioautoalliance.com/why-ontario/
- Ontario Clean Air Alliance Research Inc. (2012). Ontario's Electricity Surplus: An Opportunity To Reduce Costs. Retrieved from Ontario Clean Air Alliance: http://www.cleanairalliance.org/files/surplus.pdf
- Ontario Ministry of Economic Development, Trade and Employment. (2010, June 6). Ontario a World Leader in Auto Parts. Retrieved from Archived News Release: http://news.ontario.ca/medt/en/2012/06/ontario-a-world-leader-in-auto-parts.html?utm_source=ondemand&utm_medium=email&utm_campaign=p
- Ontario Ministry of Economic Development, Trade and Employment. (2013, April 28th). Ontario's Auto Industry. Retrieved from Invest Ontario: http://www.investinontario.com/en/Pages/OS_automotive.aspx
- Ontario Ministry of Economic Development, Trade and Employment. (2013, October 3). Who are the players? Retrieved from Invest Ontario: http://www.investinontario.com/en/Pages/OS_automotive_players.aspx
- Ontario Ministry of Training, C. a. (2013). Council of Ontario Universities. Retrieved from http://www.cou.on.ca/multiyeardata
- Ontario Smart Grid Forum. (2013). Ontario Smart Grid Progress Assessment: A Vignette. Retrieved from IESO Public Share Point: http://ieso-public.sharepoint.com/documents/smart_grid/Smart_Grid_Progress_Assessment_Vignette.pdf
- Ontario Society of Professional Engineers (OSPE). (2014, March). Wind and the Electrical Grid: Mitigating the Rise in Electricity Rates and Greenhouse Gas Emissions. Retrieved from OSPE: http://c.ymcdn.com/sites/www.ospe.on.ca/resource/resmgr/doc_advocacy/2012_doc_14mar_windelectrica.pdf
- Ontario's Workforce Shortage Coalition. (2014, 04 29). The Challenge Ahead: Averting a Skills Crisis in Ontario. Retrieved from Ontario's Workforce Shortage Coalition: http://www.workforcecoalition.ca/
- Oschinski, M., Chan, K., & Kobrinsky, L. (2014). Ontario Made: Rethinking Manufacturing in the 21st Century. Toronto: University of Toronto: Mowat Centre.
- Pollution Probe and Canadian Automobile Association. (2009, June). Primer on Automobile Fuel Efficiency and Emissions.
- Premier, O. o. (2011, August 5th). Ontario Puts a Charge into Electric Vehicle Production. Retrieved from Newsroom: http://news.ontario.ca/opo/en/2011/08/ontario-puts-a-charge-into-electric-vehicle-production.html
- Price Waterhouse Coopers. (2009). The Impact of Electric Vehicles on the Energy Industry.
- Province of Ontario. (2007). Go Green: Ontario's Action Plan On Climate Change. Toronto: Ontario Ministry of the Environment.
- Province of Ontario. (2013). Achieving Balance: Ontario's Long Term Energy Plan. Toronto: Ministry of Energy.
- Province of Ontario. (2013). 2013 LTEP Consolidated Figures and Data Tables. Toronto: Ministry of Energy.
- Ricardo-AEA and Cambridge Econometrics. (2013, March). An Economic Assessment of Low Carbon Vehicles. Retrieved from: http://www.ricardo-aea.com/cms/assets/MediaRelease/Economic-Assessment-Vehicles-FINAL2.pdf
- Roland-Holst, David. (September, 2012). Plug-in Electric Deployment in California: An Economic Assessment. University of California, Berkeley. Retrieved from: http://are.berkeley.edu/~dwrh/CERES_Web/Docs/ETC_PEV_RH_Final120920.pdf
- Sander de Bruyn, L. B. (2012). Literature review on employment impacts of GHG reduction policies for transport. CE Delft.
- Statistics Canada. (2014, April 26). Table 379-0030: Employment (SEPH), unadjusted for seasonal variation, by type of employee for selected industries classified using the North American Industry Classification System (NAICS), annual (persons),.
- Statistics Canada. (2014, April 28). Table 379-0030: Gross domestic product (GDP) at basic prices, by North American Industry Classification System (NAICS), provinces and territories.
- Statistics Canada Table 079-0003. (2014, April 04). CANSIM, Table 079-0003: New motor vehicle sales by province. Retrieved from Statistics Canada: http://www.statcan.gc.ca/tables-tableaux/sum-som/l01/cst01/econ58a-eng.htm
- Table: 051-0001, Statistics Canada. (2013). Retrieved from http://www.statcan.gc.ca/start-debut-eng.html
- Table: 477-0030, Statistics Canada. (2013). Statistics Canada. Retrieved from http://www.statcan.gc.ca/start-debut-eng.html
- Table: 477-0034, Table: 051-0001, Statistics Canada. (2013). Statistics Canada. Retrieved from http://www.statcan.gc.ca/start-debut-eng.html
- Table: 477-0053, Statistics Canada. (2013). Statistics Canada. Retrieved from http://www.statcan.gc.ca/start-debut-eng.html
- Table: 477-0053, Statistics Canada. (2013). Statistics Canada. Retrieved from http://www.statcan.gc.ca/start-debut-eng.html
- Table: 477-0053,Statistics Canada. (2013). Statistics Canada. Retrieved from http://www.statcan.gc.ca/start-debut-eng.html
- Toyota Motor Manufacturing Canada. (2014). West Plant Woodstock. Retrieved from: Toyota Motor Manfacturing Canada: http://www.tmmc.ca/en/west-plant-woodstock.html
- U.S Department of Transportation. (2010, April). Transportations Role in Reducing U.S Greenhouse Gas Emissions. Washington, D.C, U.S.A. Retrieved from http://ntl.bts.gov/lib/32000/32700/32779/DOT_Climate_Change_Report_-_April_2010_-_Volume_1_and_2.pdf
- U.S. Department of Labour. (2010, December 6). International Comparisons of Manufacturing Productivity and Unit Labor Cost Trends. Retrieved from Bureau of Labour Statistics: http://www.bls.gov/web/prod4.supp.toc.htm
- Vector Inc. Battery Management Systems. (n.d.). Retrieved from http://www.vectureinc.com/
Appendix E: List of Tables and Figures
Table 1: 2011-2025 CAFE Standards for Each Model Year In Miles Per Gallon
Table 2: 5% and 10% of Projected Passenger Vehicle Population in the Year 2025 and 2050
Table 3: Economic Impacts of Gasoline Vehicle Manufacturing (Thousands of 2011 dollars)
Table 5: Economic Impacts of Manufacturing Electric Vehicles — 2025 and 2050, 5% and 10%
Table 6: Tax Impacts of Manufacturing Electric Vehicles — 2025 and 2050, 5% and 10%
Table 9: Direct Fuel Tax Losses on Avoided Gasoline (Thousands of 2011 Dollars)
Table 10: Economic Impacts of Operations of Electric Vehicles (Thousands of 2011 dollars)
Table 11: Tax Impacts of Operation of EVs, 5% in 2025 (Thousands of 2011 Dollars)
Table 12: The Economic Impacts of Operation of EVs, 10% in 2025 (Thousands of 2011 Dollars)
Table 13: Tax Impacts of Operations of EVs, 10% in 2025 (Thousands of 2011 Dollars)
Table 14: Differential Economic Impacts of Operation of EVs, 5% in 2050 (Thousands of 2011 Dollars)
Table 15: Economic Impacts of Operation of EVs, 10% in 2050 (Thousands of 2011 Dollars)
Table 16: The Tax Impacts of Operation of EVs, 5% in 2050 (Thousands of 2011 Dollars)
Table 17: The Tax Impacts of Operations of EVs, 10% in 2050 (Thousands of 2011 Dollars)
Table 18: Charging Station Infrastructure Costs (Thousands of 2011 Dollars)
Table 19: The Economic Impacts of Charging Station Infrastructure (Thousands of 2011 Dollars)
Table 20: The Tax Impacts of Charging Station Infrastructure (Thousands of 2011 Dollars)
Table 21: Total Employment Gains in All Four Scenarios
Table 22: Total and Net Educational Requirements Manufacturing (all scenarios)
Table 23: Total and Net Educational Requirement Operations (All Scenarios)
Table 24: Total and Net Educational Requirements Manufacturing and Operations (All Scenarios)
Table 25: Share of Sectoral Employment by Level of Education
Figure 1: Comparison-GDP of Ontario's Good and Service Producing Sectors (Chained $2007)
Figure 2: Ontario's Manufacturing Sector-GDP, Total Employees and Percentage of Share of GDP
Figure 3: Cdn/US Exchange Rate versus WTI Crude Oil Spot Prices
Figure 4: Cdn/US Exchange Rate versus US and Canada Unit Labour Costs in USD
Figure 8: Ontario's Total Emissions (Mt)
Figure 11: GHG Emissions-Light Duty Gasoline Trucks versus Light Duty Gasoline Vehicles
Figure 12: Total Emissions versus Total Trucks and Vehicles
Figure 13: CO2 Equivalents Lifecycle Comparison Base Case, UCLA Study
Figure 14: Ontario's Emission Intensity (GHG/GDP)
Figure 15: Share of Electricity Generation Sources of January 15th, 2014
Figure 16: Ontario's Electricity Generation By Sources
Figure 17: Ontario's Forecast Electricity Production Supply Mix
Figure 18: Forecast Energy Production TWh (%) 2013 and 2032
Figure 19: Historical and Target Energy Reduction- Annual Energy Savings (TWh)
Figure 20: Ontario's Forecast Electricity Production Percentage by Resources (TWh) in 2032
Figure 21: Installed Capacity (MW) and Percentage Share-by Resources 2013 and 2025
Figure 22: Capacity Contribution at Time of Peak Demand Compared to Resource Requirements (MW)
Figure 23: Gross Electricity Demand 2004-2032
Figure 24: 2012 Canadian Vehicle Sales By Type
Figure 25: BEV and PHEV Sales by Province, Compared 2012 and 2013
Figure 26: Canadian Charging Station Locations By Province
Figure 27: Economic Impact of Manufacturing Gasoline Vehicles — 2025 and 2050, 5% and 10%
Figure 28: Tax Impacts of Gasoline Vehicle Manufacturing (Thousands of 2011 dollars)
Figure 29: Economic Impacts of Manufacturing Electric Vehicles — 2025 and 2050, 5% and 10%
Figure 30: Tax Impacts of Manufacturing Electric Vehicles (Thousands of 2011 dollars)
Figure 36: The Differential Tax Impacts of Manufacturing EVs (Thousands of 2011 Dollars)
Figure 37: The Differential Economic Impacts of EV Operations
Figure 38: Direct Fuel Tax Losses on Avoided Gasoline (Thousands of 2011 Dollars)
Figure 40: The Tax Impacts of Operation of EVs, 5% in 2025 (Thousands of 2011 Dollars)
Figure 41: The Economic Impacts of Operation of EVs, 10% in 2025 (Thousands of 2011 Dollars)
Figure 42: The Tax Impacts of Operation EVs, 10% in 2025 (Thousands of 2011 Dollars)
Figure 43: Economic Impacts of EV operation, 5% and 10% in 2050 (Thousands of 2011 Dollars)
Figure 44: Tax Impacts of EV Operation, 5% and 10% in 2050 (Thousands of 2011 Dollars)
Figure 45: The Economic Impacts of Charging Station Infrastructure (Thousands of 2011 Dollars)
Figure 46: The Tax Impacts of Charging Station Infrastructure (Thousands of 2011 Dollars)
Figure 47: Full Time Employment by EV manufacturing (4 Scenarios)
Figure 48: Employment Gains and Loses as Result of EV Manufacturing
Figure 49: Employment Gains and Losses As Result of EV Operations (2025, 5% and 2050, 5%)
Figure 50: Categories With the Most Significant Job Gains as Result of Infrastructure Development
Figure 51: Total and Net Educational Requirements Manufacturing and Operations (All Scenarios)
Figure 52: Degrees Awarded in Ontario Fall 2001 - Fall 2012
Figure 53: Degrees Awarded in Ontario Fall 2001 - Fall 2012
Figure 54: Share of Graduates by Instructional Programs in Ontario from 1999-2011
Figure 55: Degrees/Diplomas awarded by subject area per 1000 population 2001-2012
Figure 56: Total Major Trade Group Registrations in Ontario 1991-2011
Figure 57: Growth Rates in Trades Registrations in Ontario 1991-2011
Figure 58: 80% Emission Reduction from LDGV (EV Growth and CAFE Standards)
Figure 59: LDGT Vehicle Population and Emissions 2011-2050
Figure 60: GT80 Calculator Adoption Scenario Outcomes
Figure 61: Snapshot of GT80 Calculator Tool
Figure 62: Emission Reduction in 5% Scenario
Figure 63: Annual Impact of Manufacturing EVs in Ontario, US Telephone Adoption Scenario
Figure 64: Annual Operating Impact of EVs in Ontario, Mobile Phone Scenario
Footnotes
[1] (Province of Ontario, 2007)
[2] (Province of Ontario, 2007)
[3] (ECO Canada, 2010)
[4] (Bank of Canada, 2012)
[5] (Bank of Canada, 2012)
[6] (Oschinski, Chan, & Kobrinsky, 2014)
[7] (Oschinski, Chan, & Kobrinsky, 2014)
[8] (Oschinski, Chan, & Kobrinsky, 2014)
[9] (Oschinski, Chan, & Kobrinsky, 2014)
[10] Current account determines the flow of goods, services and investment income between Canada and the rest of the world
[11] An emerging market is defined as a country with low-to-middle per capita income as measured by the World Bank. Emerging markets are usually considered to be in a transitional phase toward developed-market (i.e., industrialized) status and in the process of building liquid equity, debt and foreign-exchange markets. Within the broad category of emerging markets, there is a group of approximately 25 - 40 countries classified as frontier
markets. These are countries whose governmental infrastructure, economies and financial markets are not yet as fully formed as those of emerging countries. (HSBC Global Asset Management, 2011)
[12] (Library of Parliament, 2013)
[13] (rabble.ca, 2012 )
[14] (Ontario Automotive Communities Alliance, 2013)
[15] (Ontario Ministry of Economic Development, Trade and Employment, 2010)
[16] (Ontario Ministry of Economic Development, Trade and Employment, 2013)
[17] (Ontario Automotive Communities Alliance, 2013)
[18] (Statistics Canada, 2013), Table 379-0030
[19] (Statistics Canada, 2013)
[20] (Statistics Canada, 2014). This includes NAIC codes 3361,3362,3363 (motor vehicle manufacturing, motor vehicle body and trailer manufacturing, and motor vehicle parts manufacturing).
[21] Includes NAICS 3361,3362,3363
[22] (Statistics Canada, 2014)
[23] (Keenan, 2014)
[24] (Environment Canada, 2013)
[25] (Environment Canada, 2013)
[26] (Environment Canada, 2013)
[27] (Environment Canada, 2013)
[28] (Environment Canada, 2013)
[29] (U.S Department of Transportation, 2010)
[30] (Environment Canada, 2013)
[31] (Environment Canada, 2013)
[32] (Statistics Canada Table 079-0003, 2014)
[33] (Statistics Canada Table 079-0003, 2014)
[34] Trucks include minivans, sport-utility vehicles, light and heavy trucks, vans and buses
[35] (Environmental Comissioner of Ontario, 2014)
[36](Pollution Probe and Canadian Automobile Association, 2009)
[37] (Government of Canada, 2012)
[38] (Hill, 2013)
[39] (Hill, 2013)
[40] (Hill, 2013)
[41] (Aguirre, et al., 2012)
[42] (Aguirre, et al., 2012)
[43] (Aguirre, et al., 2012)
[44] (Aguirre, et al., 2012)
[45] (Hawkins, 2013)
[46] (Hawkins, 2013)
[47] (Hawkins, 2013)
[48] (Environment Canada, 2013)
[50] (Independent Electricity System Operator, 2014)
[51] (Independent Electricity System Operator, 2014)
[52] (Independent Electricity System Operator, 2014)
[53] (Independent Electricity System Operator, 2014)
[54] (Independent Electricity System Operator, 2014)
[55] (Ontario Power Authority , 2014)
[56] OPA EV demand assumptions table in appendix
[57] http://www.usnews.com/news/articles/2012/02/15/city-grids-may-not-be-ready-for-electric-cars
[58] (Toyota Motor Manufacturing Canada, 2014)
[59] Plug in Electric Vehicles in this report include BEVs and PHEVs.
[60] (Electric Mobility Canada (EMC), 2010)
[61] (Electrovaya, 2014)
[62] (Vector Inc. Battery Management Systems)
[63] (BET Services Inc, 2014)
[64] (AZD Azure Dynamics, 2010)
[65] (Magna Inerational )
[66] (Electric Mobility Canada (EMC), 2010)
[67] (Independent Electricity System Operator, 2014)
[68] (Ontario Clean Air Alliance Research Inc, 2012)
[69] (Ontario Society of Professional Engineers, 2014)
[70] (Ontario Society of Professional Engineers, 2014)
[71](Ministry of Training, Colleges and Universities , 2014)
[72] (Ontario's Workforce Shortage Coalition, 2014)
[73] (Ontario's Workforce Shortage Coalition, 2014)
[74] EV industry in Ontario includes vehicle manufacturers and suppliers of parts and services in EV industry's supply chain
[75] (Ontario Smart Grid Forum, 2013)
[76] (Ontario Smart Grid Forum, 2013)
[77] (Ontario Smart Grid Forum, 2013)
[78] (U.S Bureau of Labour Statistics, 2014)
[79](U.S Bureau of Labour Statistics, 2014)
[80](U.S Burea of Labour Statistics, 2014)
[81] (U.S Bureau of Labour Statistics, 2014)
[82] (U.S Bureau of Labour Statistics, 2014)
[83](U.S Burea of Labour Statistics, 2014)
[84] (U.S Bureau of Labour Statistics, 2014)
[85] (U.S Bureau of Labour Statistics, 2014)
[86] (Munro, 2013)
[87] (Munro, 2013)
[88] (Miner, 2010)
[89] (Miner, 2010)
[90] (ECO Canada, 2010)
[91] (Ontario's Workforce Shortage Coalition, 2014)
[92] (ECO Canada, 2010)
[93] (Ministry of Training, Colleges and Universities, 2014)
[94] (Electricty Human Resources Canada, 2013)
[95] (Province of Ontario, 2013)
[96] (Ontario's Workforce Shortage Coalition, 2014)
[97] (Munro, 2013)
[98] (Munro, 2013)
[99] (National Electrical Trade Council, 2014)
[100] (Natural Resource Canada, 2010)
[101] (Munro, 2013)
[102] (Munro, 2013)
[103] Emissions were calculated by determining the emissions (kg) per truck and multiplying that by the total truck population each year. Per truck emissions were determined by dividing total emissions from LDGT in 2011 by the total number of LDGT on the roads in the same year. Growth rates were determined using an S-Curve growth rate.
[104] The scenarios all maintain the inputs at their starting values; the values used in ERL's economic impact analysis. Truck growth rate is 2%, car growth rate is 1%, gas prices are $1.23/litre, average kilometres driven per year is 18,000km/year, 100% of vehicle charging occurred during on peak hours ($0.11/kWh), travel per kWh of charging was 4.67km and the price differential between EVs was $7500.
[105] www.communitech.ca
[106] (Amgen Canada Inc and Lets Talk Science, 2013)
[107] (Amgen Canada Inc and Lets Talk Science, 2013)
[108] (Amgen Canada Inc and Lets Talk Science, 2013)
[109] (Shubra, 2010)
[110] (Shubra, 2010)
[111] (Lizzie Crowley, 2013)
[112] www.gartner.com